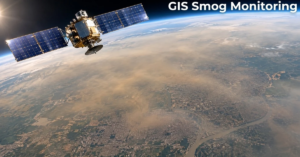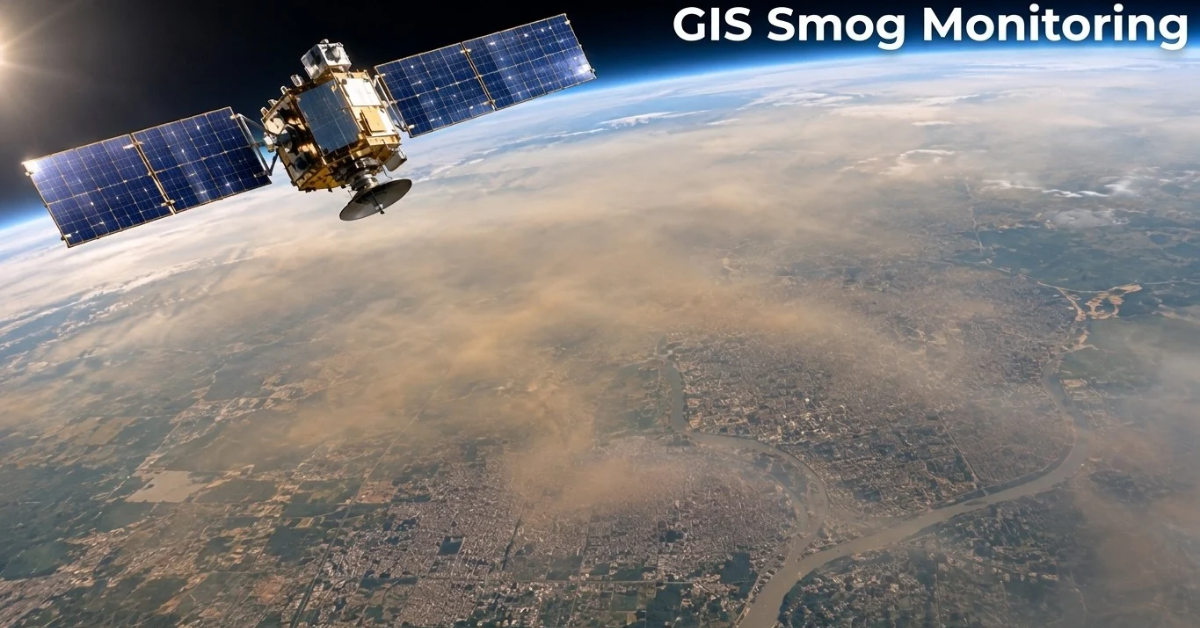
GIS smog monitoring uses satellite sensors to see smog from above. Satellite instruments detect gases and aerosols by measuring how light interacts with the atmosphere. Scientists combine these observations with weather data, models, and ground measurements to estimate surface-level pollution. GIS software then turns that data into maps. Together, they show where smog starts, where it moves, and who breathes it.
This matters because smog does not stay in one place. It drifts across cities and borders. A single ground station cannot see the full picture. Satellites can.
In this guide, you will learn how GIS smog monitoring works, what satellites add, and where the data has limits. If you are new to the topic, start with our guide on smog vs fog.
| Quick Answer: What Is GIS Smog Monitoring?GIS smog monitoring combines satellite observations, atmospheric models, ground measurements, and GIS software to map air pollution. Satellites detect atmospheric gases and aerosols, while GIS tools analyze their distribution, movement, and potential impact. This helps identify pollution hotspots, regional trends, and areas facing higher exposure. |
Key Terms in Simple Words
- GIS: A geographic information system. It maps and analyzes data by location.
- Aerosol optical depth (AOD): A measure of how strongly airborne particles scatter and absorb sunlight through the air column.
- PM2.5: Fine particles smaller than 2.5 micrometers that can enter the lungs.
- TROPOMI: The instrument on the Sentinel-5P satellite that measures atmospheric gases.
- Back trajectory: A path that traces where an air mass came from, using wind data.
Why Ground Monitors Are Not Enough
Ground monitors are accurate. They measure air at one exact spot. That is their strength. It is also their weakness.
Many regions have only a few stations. Some towns have none. Smog can be thick in one area and light in another just a few kilometers away. A sparse network misses these gaps.
Ground stations also cost money to build and run. They need power, upkeep, and regular calibration. Many developing regions struggle to cover all of this.
Satellites fill the gap. Covering large areas each day, satellites provide a broader view of pollution without requiring monitoring stations on every street. However, their data works best alongside ground measurements rather than as a replacement for them.
How GIS Smog Monitoring Works
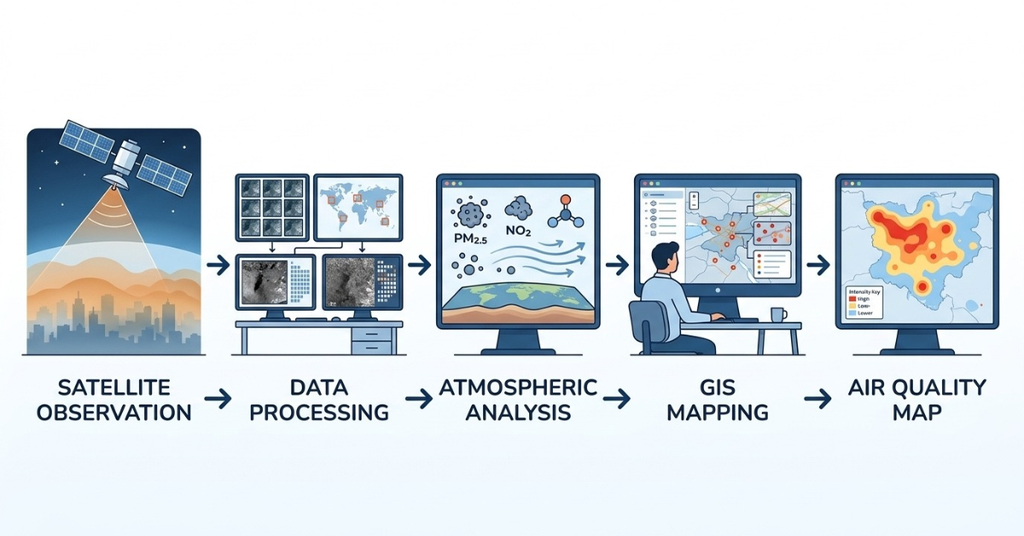
The process has four simple steps.
Step 1: Sensors Read the Atmosphere
Satellites carry instruments that read light. Sunlight passes through the air and bounces back. Gases and particles change that light in known ways. The sensor records these changes.
Step 2: Software Converts Light into Pollution Data
Scientists use models to turn the light signal into numbers. These numbers show how much of a pollutant is in the air column above a place.
Step 3: Data Is Sent to Earth
The satellite sends raw data to ground stations. Space agencies process it and release it. Much of this data is free to use.
Step 4: GIS Turns Data into Maps
This is where GIS smog monitoring begins. GIS software places each reading on a map. It adds layers like roads, factories, farms, and population. Now the data tells a story.
What Satellites Measure
Smog is not one thing. It is a mix. Satellites track several parts of that mix.
- Nitrogen dioxide (NO2): This gas comes from vehicles, power plants, and industry. It is a strong marker of traffic and fuel burning.
- Aerosol optical depth (AOD): This measures how strongly airborne particles scatter and absorb sunlight through the air column. Scientists use it with weather and ground data to estimate surface-level PM2.5.
- Fire and heat spots: Satellites detect active fires, which can include crop burning and forest fires. A fire spot alone does not prove the cause.
- Carbon monoxide and other gases: Some sensors track these too. They help trace smoke plumes.
A note on accuracy. Satellites see the whole air column, not just the air at ground level. Scientists use models and ground data to estimate what people actually breathe.
Key Satellites Used for Smog Tracking
Several missions support air quality work today.
The European Space Agency runs Sentinel-5P. It carries an instrument called TROPOMI. It maps gases like nitrogen dioxide, carbon monoxide, sulfur dioxide, and ozone every day across the globe. Its pixels measure about 5.5 km by 3.5 km at nadir, directly below the satellite. You can read more on the Copernicus Sentinel-5P mission page.
NASA and partners run TEMPO. It sits in a fixed orbit over North America. It launched in April 2023 and takes hourly daytime readings of pollutants. This is a big step, because most older missions pass over a place only once a day. TEMPO does not cover South Asia, but it shows where air quality monitoring is heading. Learn more on the TEMPO mission site.
Instruments such as NASA’s MODIS and VIIRS, carried on different satellite missions, provide aerosol observations and active fire detections. They have been used for many years in smog research.
Specific details can change as missions update. Always check the official mission pages for current specs.
Satellite Monitoring Capabilities at a Glance
| Satellite or instrument | What it monitors | Use in smog work |
| Sentinel-5P / TROPOMI | Gases such as NO2, CO, SO2, and ozone | Pollution mapping |
| MODIS | Aerosols and active fires | Regional smog analysis |
| VIIRS | Aerosols and active fires | Fire hotspot detection |
| TEMPO | Major air pollutants, hourly | Monitoring over North America only |
What GIS Adds to Satellite Data
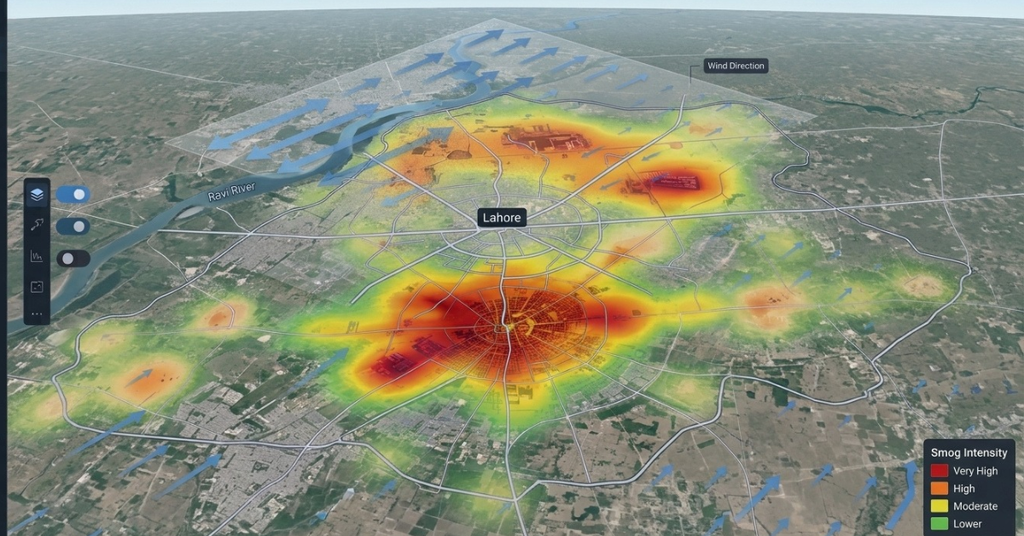
Satellite data alone is a grid of numbers. GIS makes it useful. GIS stands for geographic information system. It is a tool for mapping and analyzing data by location.
Here is what GIS does in smog work.
It Layers Many Data Sources
GIS can stack satellite readings with ground station data, weather data, and land use maps. This gives a fuller picture than any single source.
It Finds Hotspots
GIS tools can spot clusters of high pollution. Planners can then ask why. Is it a highway? A brick kiln belt? A burning field?
It Tracks Smog Movement
Wind data combined with satellite maps shows how smog travels. This helps trace smog back to its source region.
It Links Smog to People
GIS can overlay population maps on smog maps. This shows which schools, hospitals, and neighborhoods face the highest exposure.
GIS Smog Monitoring Workflow: From Raw Data to Smog Map
Here is how a typical GIS smog monitoring project runs.
- Collect data. Download satellite products for your region and dates.
- Clean the data. Remove cloudy pixels and bad readings.
- Add ground data. Bring in station readings to correct errors.
- Add context layers. Include wind, roads, industry, and population.
- Analyze. Find hotspots, trends, and source zones.
- Publish. Share maps, dashboards, or alerts with decision-makers.
Each step improves trust in the final map.
Where GIS Smog Monitoring Helps Most
Early Warning
Satellites can spot smoke from crop burning before it reaches a city. Authorities can warn people sooner. This fits well with the idea of early warning in disaster work. See how similar tools work in our guide to AI in disaster management.
Source Tracking
Maps help show which areas add the most pollution. This makes policy more targeted. Instead of blanket rules, officials can focus on real hotspots.
Health Planning
Health teams can use smog maps to place clinics and plan for surges in breathing problems. Poor air and climate stress can also weigh on mental health, as we explain in our guide on climate anxiety.
Policy Checks
Did a smog rule work? Satellite trends over several seasons can help answer that. They give a view that does not depend on one station.
Smog Monitoring in Pakistan and South Asia
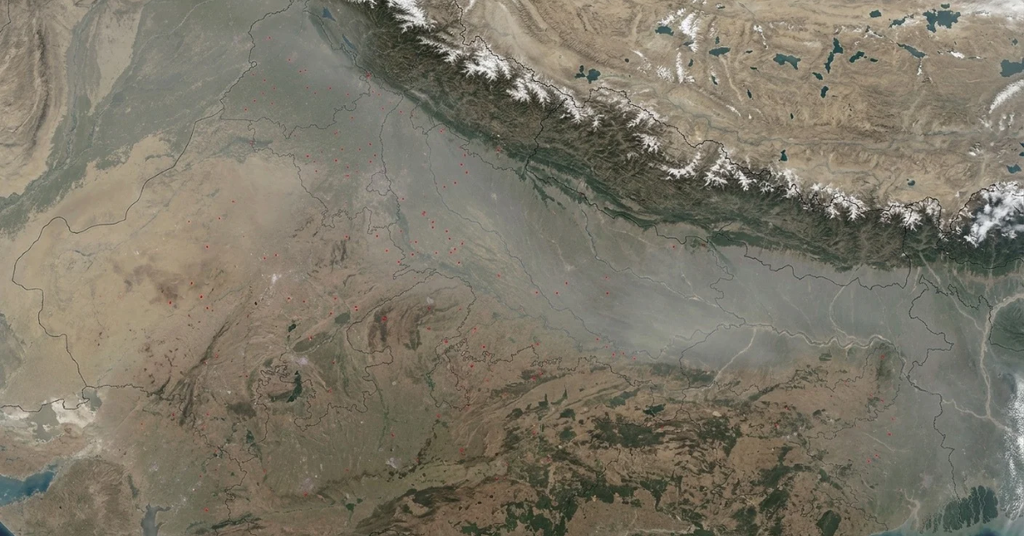
South Asia faces heavy smog each winter. Cold air traps pollution near the ground. Crop residue burning, traffic, and industry add to the load. Punjab is often in the news during this season. According to a SUPARCO satellite assessment reported on November 13, 2026, Punjab recorded an average aerosol optical depth (AOD) of 1.52, while 32 of its 36 districts had high to extremely severe smog conditions.
Ground monitors in the region are limited. This makes GIS smog monitoring very useful. It can show smog spreading across districts and across borders. It can also show fire spots in farm areas. Maps also let officials compare districts and see how changing winds affect cities such as Lahore, Multan, Faisalabad, and Gujranwala.
For a closer look at the local picture, read our full guide on smog in Pakistan.
GIS can also connect smog maps with other risks. For example, pollution, heat, and flooding often hit the same communities. A shared map helps planners see the full risk. Our work on disaster risk management with GeoAI shows how layered maps support better decisions. For more on Pakistan, see our guides on flood forecasting in Pakistan and climate intelligence.
Smog Monitoring Across the India-Pakistan Border
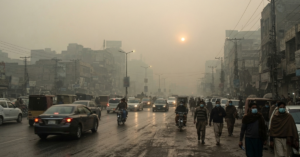
Smog does not stop at a border. Indian Punjab and Pakistani Punjab share one air basin, so winds can carry pollution in both directions. In some winters, Lahore and Delhi face hazardous air in the same weeks. Satellite images show the haze spreading across both countries.
Smog monitoring across the India-Pakistan border works best when both sides use shared data. Satellites see fire spots, haze, and aerosols on either side. GIS then adds wind paths to show how air moves. One satellite analysis by the Pakistan Air Quality Initiative counted 2,753 fire hotspots in Pakistan and 957 in India within 300 kilometers of Lahore between October 27 and November 2, 2026. These detections indicate active fire locations, not confirmed crop-burning incidents. Ground checks and more spatial analysis are needed to find the actual sources and their share of the pollution.
Detecting pollution, tracking its movement, and identifying its source are three different tasks. Wind direction alone cannot prove who caused a spike. Experts combine satellite data, ground readings, and weather models. Some Pakistani policy groups have also called for a joint monitoring system backed by satellite data. A shared view would help both nations act on facts, not blame.
Limits of GIS Smog Monitoring
Good science admits its limits. Satellite smog data has a few.
- Clouds block the view. Optical sensors cannot see through thick clouds. Winter fog and clouds can leave gaps.
- Column versus ground. A satellite measures the air column. People breathe at ground level. Models bridge this gap, but errors can occur.
- Resolution varies. Some sensors see large pixels. Small local hotspots can blur together.
- Revisit time. Many satellites pass once a day. Smog can change faster than that.
- Bright surfaces. Snow, deserts, and bright ground can confuse some aerosol readings.
The best approach is to combine satellites, ground stations, and weather models. Each covers the weak spots of the others.
Fog Versus Smog in Satellite Images
A common problem is telling smog apart from fog. Both look hazy. Both reduce visibility.
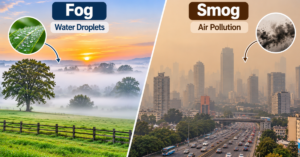
Fog is made of water droplets. Smog is made of pollutants and particles. Satellites use different signals to tell them apart. Gas readings like nitrogen dioxide point to pollution. Fire spots point to smoke. Weather data helps confirm fog.
If you want a plain-language comparison, see our guide on smog vs fog.
The Future of GIS Smog Monitoring
The field is moving fast.
- More frequent data. Newer missions give hourly readings, not just daily ones.
- AI models. Machine learning can turn satellite data into street-level estimates of PM2.5.
- Low-cost sensors. Community sensors can add dense ground data to satellite maps.
- Open dashboards. More agencies now share live air quality maps with the public.
These tools will make GIS smog monitoring faster, cheaper, and easier to use.
How to Get Started with GIS Smog Monitoring
You do not need to be a scientist. Here are simple ways to begin.
- Use free satellite products from space agencies.
- Try open GIS tools to view and map the data.
- Compare satellite maps with local air quality readings.
- Work with a geospatial team if you need custom analysis.
Start small. Pick one city and one season. Build from there.
AI Geo Navigators work with GIS and satellite data to turn raw numbers into maps that support real decisions. If you need help with spatial analysis, explore our GIS mapping services.
Key Takeaways
- GIS smog monitoring maps satellite pollution data across large areas.
- GIS turns raw satellite data into maps that people can act on.
- Satellites track gases, aerosols, and fire spots.
- Ground stations and satellites work best together.
- Clouds, resolution, and the column-versus-ground gap are real limits.
- The approach is very useful in regions with few ground monitors.
Conclusion
GIS smog monitoring gives us a wide view of a problem that ground stations alone cannot cover. It shows where smog begins, how it travels, and who is exposed. GIS makes that data easy to read and act on.
It is not perfect. Clouds and model errors still matter. But when satellite data, ground data, and GIS work together, the picture gets much clearer. Better maps lead to better warnings, smarter policy, and healthier air.
FAQs
How Can Satellite Data Help Monitor Air Pollution in Pakistan?
Satellites measure aerosols, gases, and fire spots across wide areas, filling gaps where ground stations are few. SUPARCO’s satellite assessment reported on November 13, 2026, put Punjab’s average aerosol optical depth at 1.52. AOD shows haze in the air column, not ground-level PM2.5.
Can Satellite Imagery Detect Smog and Air Pollution Coming from India into Pakistan?
Partly. Satellites show haze, smoke, and fire spots on both sides of the border, and wind back trajectories add air movement. In November 2026, PAQI found that 45 of 48 air paths into Lahore, Kasur, and Sialkot crossed Indian territory within 12 hours. This shows movement, not conclusive proof of the source.
Which Satellites Are Used to Monitor Air Pollution in Pakistan?
Pakistan studies mainly use the MODIS and VIIRS instruments for aerosols and fires, and Sentinel-5P for gases like nitrogen dioxide and carbon monoxide. SUPARCO also pairs satellite data with mobile air quality labs in Karachi, Lahore, and Gilgit. Check each mission’s official page for current details.
How Can GIS Technology Identify the Sources of Air Pollution in Lahore and Other Pakistani Cities?
GIS overlays satellite pollution maps with fire spots, factories, brick kilns, roads, and wind data. Hotspots that match a source layer suggest likely causes, and field checks confirm them. A satellite fire spot is not always crop burning, so ground inspection still matters.
Can Satellite Data Accurately Measure PM2.5 and AQI Levels in Pakistan?
Not directly. Satellites measure aerosol optical depth, which covers the whole air column, not ground-level PM2.5. Models estimate PM2.5 using weather and ground data, and AQI is calculated from ground monitors. One Lahore study found MODIS aerosol data matched ground-based aerosol readings fairly well (R2 of 0.78).
How Can Geospatial Intelligence Predict the Movement of Smog Across Pakistan?
Geospatial intelligence combines satellite, ground, and weather data in GIS. Wind models and AI then project where smog may drift over the next hours or days. Forecasts stay uncertain because winds, inversions, and rain can change fast.
References
Last checked: November 14, 2026.
- Pakistan Observer, “Satellite monitoring shows severe smog across 32 Punjab districts,” November 13, 2026 (SUPARCO report, average aerosol optical depth 1.52).
- The Express Tribune, “Lahore fire hotspots spike amid smog,” November 5, 2026 (PAQI fire hotspot count and expert caution on fire spots).
- Outlook India, “Pakistan Blames India’s Fireworks, But Lahore’s Own Pollution Sources Tell Another Story,” November 2026 (PAQI back trajectory analysis, released November 10).
- Dawn, “Suparco launches project to track pollution sources,” November 7, 2024 (SUPARCO mobile air quality labs in Karachi, Lahore, and Gilgit).
- Butt, F. M. et al., “Comparison of Aerosol Optical Depth Products from Multi-Satellites over Densely Populated Cities of Pakistan,” International Letters of Natural Sciences (MODIS accuracy over Lahore).
- Qayyum, F. et al. (2022), “Air pollution trends measured from MODIS and TROPOMI: AOD and CO over Pakistan,” Journal of Atmospheric Chemistry, 79(3), 199-217.
- Copernicus and ESA, Sentinel-5P mission and TROPOMI nitrogen dioxide product pages (daily global coverage, pixel size since August 2019).
- NASA and Smithsonian Astrophysical Observatory, TEMPO mission overview (launched April 7, 2023, hourly daytime scans over North America).
- Sustainable Development Policy Institute (SDPI), “Punjab in a haze,” 2026 (call for joint monitoring supported by satellite data).