We show what a flood, heatwave, landslide or drought could mean for people, assets and services under defined scenarios. You can compare options, set priorities and justify decisions with evidence.
Illustrative data, not a live feed or forecast.
Hazard + exposure
plus vulnerability, the core of the analysis
Current and future
scenarios on a common basis
Asset to district
analysis at the scale you need
Decision ready
ranked priorities and options
The IPCC describes climate risk as the result of hazards interacting with exposure and vulnerability. We assess all three, so results reflect both the event and what stands in its path.
A geospatial inventory of what could be affected.
Assessment of how sensitive people and assets are to harm.
A set of plausible events and futures tailored to your decisions.
Estimated impact on assets, services and communities.
Risk analysis for organizations, portfolios and supply chains.
A comparison of what can be done to reduce the risk.
Five stages, from selecting scenarios to a prioritized set of actions.
We agree the assets, hazards, time horizons and decisions.
Assessment framework
We define events using hazard models and climate data.
Scenario set
We compile asset and population data and assess vulnerability.
Exposure database
We calculate effects under each scenario and test sensitivity.
Impact results
We compare options and document the evidence.
Risk report and action plan
Projects from our risk and vulnerability portfolio.
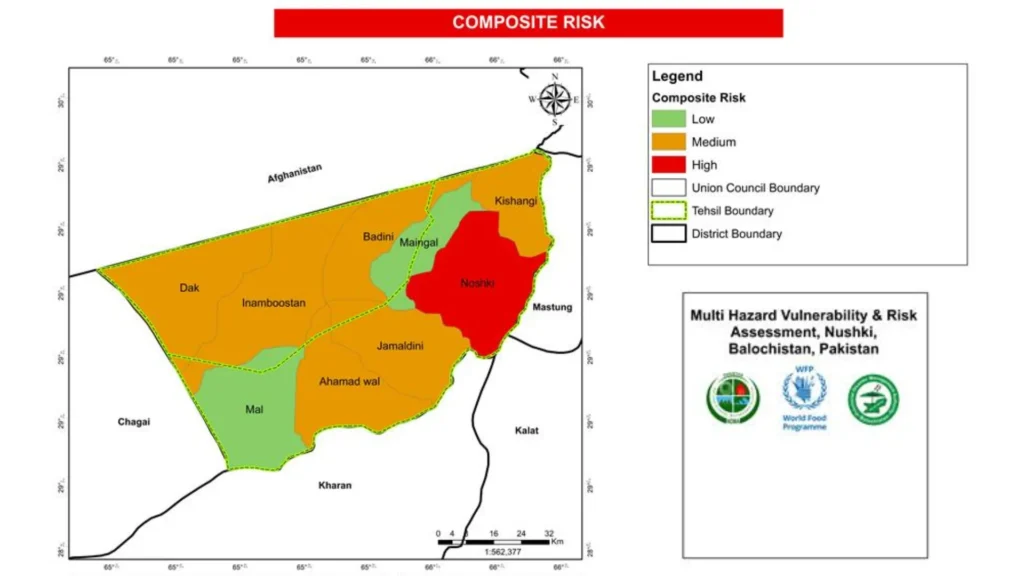
Nushki, Balochistan
Risk-prone zones, communities and assets mapped for the National Disaster Management Authority.
Client: NDMA
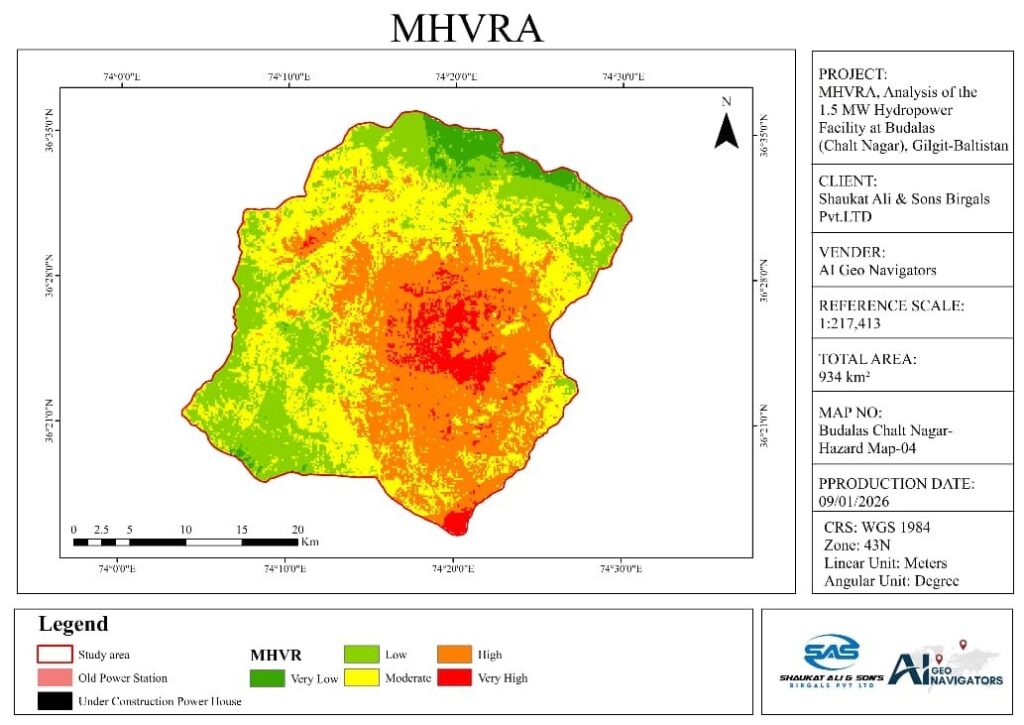
Budalas, Nagar, Gilgit-Baltistan
Flood, slope, seismic and climate hazards assessed for PWD Gilgit.
Client: PWD Gilgit
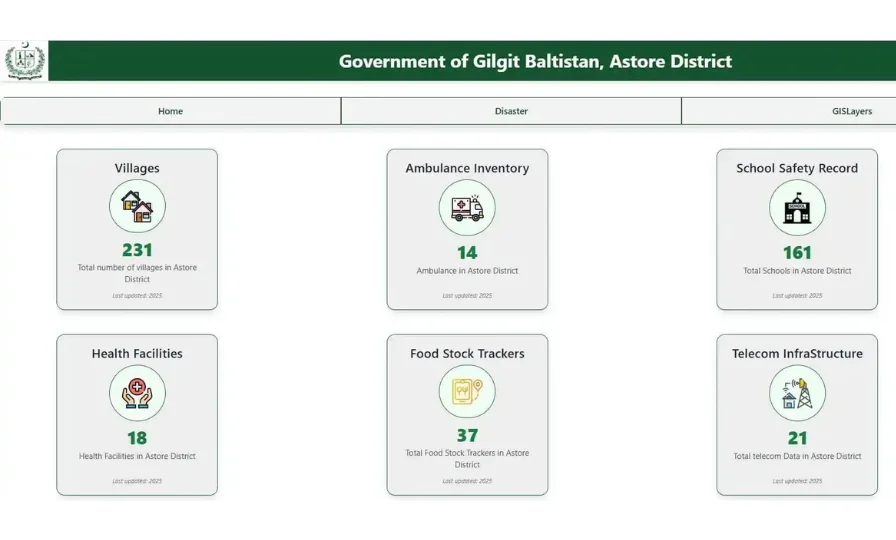
Astore, Gilgit-Baltistan
Web portal with multi-hazard vulnerability and risk layers for the district administration.
Certificate of appreciation, Deputy Commissioner Astore
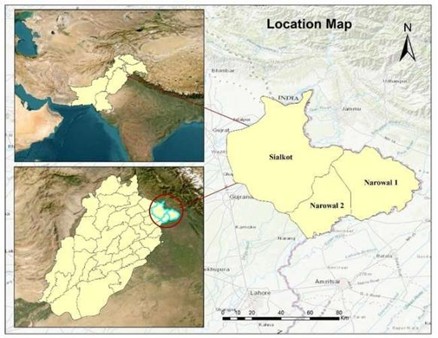
Sialkot and Narowal, Punjab · Aug 2025
Flood extent from Sentinel-1 radar with CHIRPS rainfall to explain the drivers.
1,045 km² affected land mapped
Hazard data, exposure mapping and vulnerability analysis stay in one connected workflow.
Our portfolio includes multi-hazard vulnerability and risk assessments at district and site level.
Our information security management is certified to ISO/IEC 27001.
We provide maps and data for specialists, with concise findings for decision makers.
We combine hazard, exposure and vulnerability data with methods suited to the sector.
Tell us the problem and the area. We will suggest the simplest way to solve it.
A hazard study shows what could happen. An impact assessment estimates the consequences for people, assets, services and budgets.
A scenario defines the hazard event, the time period and the assumptions about climate, exposure and vulnerability. We usually compare a range of scenarios.
Yes. We can combine climate projections with hazard models to compare current and future conditions.
It can provide physical-risk inputs. IFRS S2 requires climate-related scenario analysis, including a scenario consistent with limiting warming to 1.5°C, along with disclosure of assumptions and time horizons. Your auditors and advisers should confirm your reporting approach.
Yes, where asset values and suitable damage functions are available. We present ranges and state the assumptions.
Asset lists, locations, values, past loss records and planning priorities help most. We can use open data where your records are limited.
Climate Tech Services
Flood, GLOF, landslide, heat and drought models that show where a hazard can reach.
Climate Tech Services
Downscaled climate projections for planning horizons, with uncertainty stated.
Climate Tech Services
Automatic weather stations, industrial sensors and telemetry, installed and maintained.
Tell us the assets, the area and the decision. We will reply with a clear plan and a quote.
