We simulate how floods, glacial lake outbursts, landslides, heat and drought can affect an area. You get mapped results that show extent, severity and likely timing for planning and early warning.
Illustrative data, not a live feed or forecast.
Multi-hazard
flood, GLOF, landslide, heat and drought
Physics and data
models matched to the hazard
Validated
checked against past events where data exists
GIS ready
layers for planning and early warning
Each hazard needs its own method. We choose the model according to the question, the available data and the level of detail your decision requires.
Hydrology and hydraulic modeling for river systems and floodplains.
Rapid flood simulation for steep catchments and dense urban areas.
Simulation of sudden releases from glacial lakes and water structures.
Terrain analysis that identifies unstable slopes and likely runout paths.
Modeling of slow-onset hazards and their spatial patterns.
A combined view of hazards that overlap or trigger each other.
Five stages, from defining the event to outputs your team can use and maintain.
We set the hazard, study area, return periods and decisions.
Modeling plan
We process terrain, land cover, rainfall, flow and past event records.
Input datasets
We configure the method and test sensitivity to key inputs.
Configured model
We compare results with past events and observations where available.
Validation report
We publish hazard layers and document assumptions.
Maps, data and guidance
Projects from our hazard and risk portfolio.
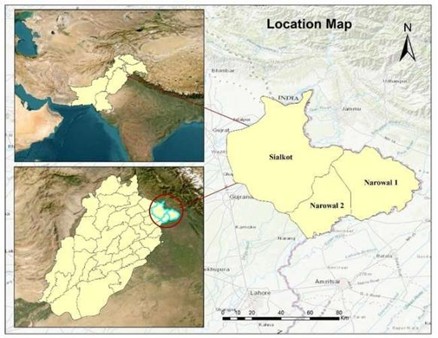
Sialkot and Narowal, Punjab · Aug 2025
Flood extent from Sentinel-1 radar with CHIRPS rainfall to explain the drivers.
1,045 km² affected land mapped
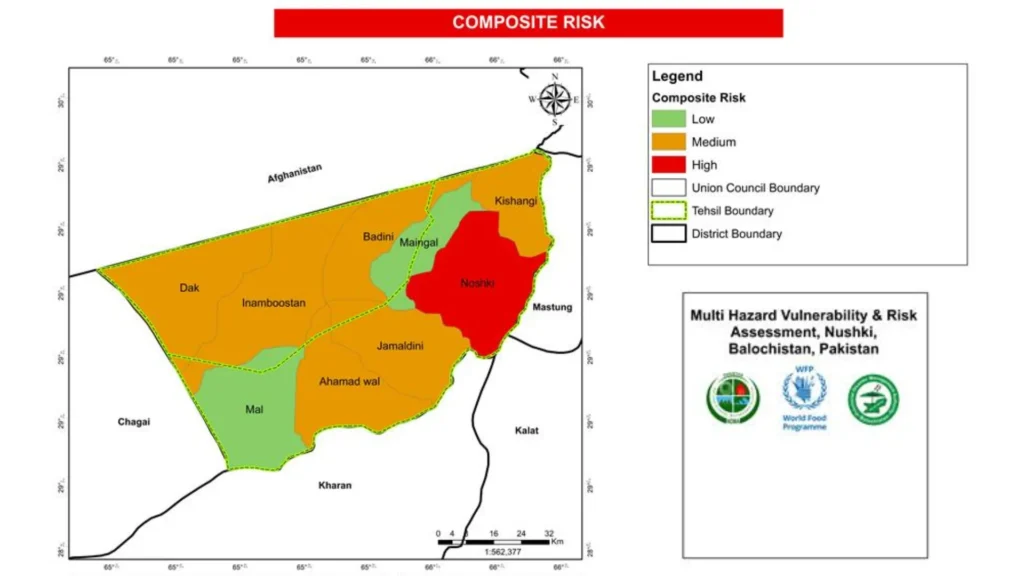
Nushki, Balochistan
Risk-prone zones, communities and assets mapped for the National Disaster Management Authority.
Client: NDMA
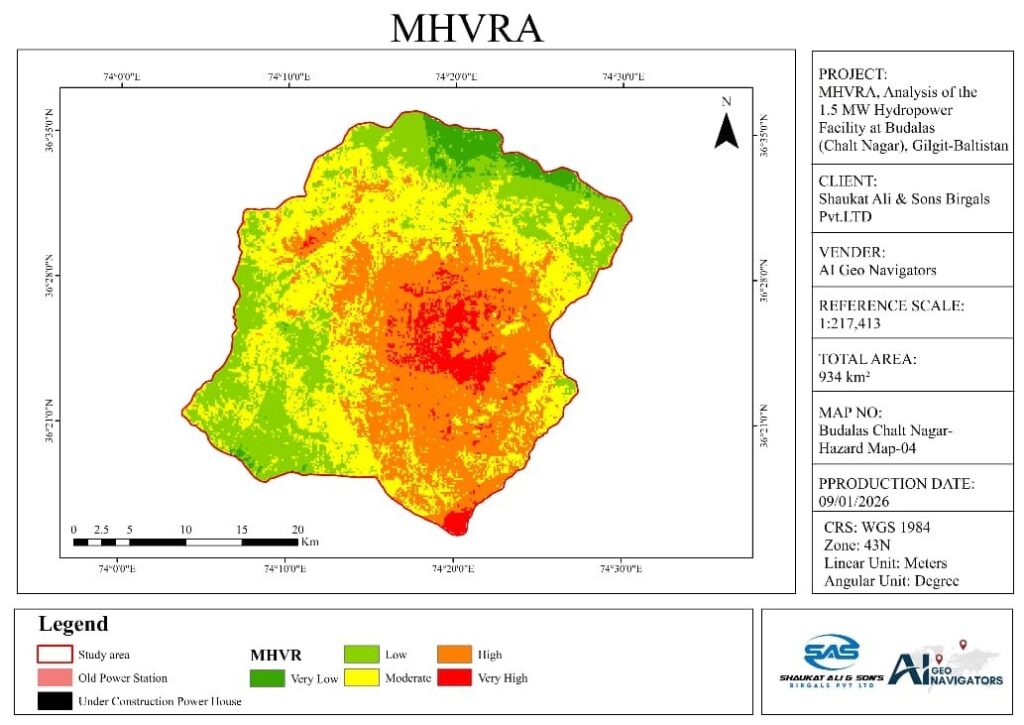
Budalas, Nagar, Gilgit-Baltistan
Flood, slope, seismic and climate hazards assessed for PWD Gilgit.
Client: PWD Gilgit
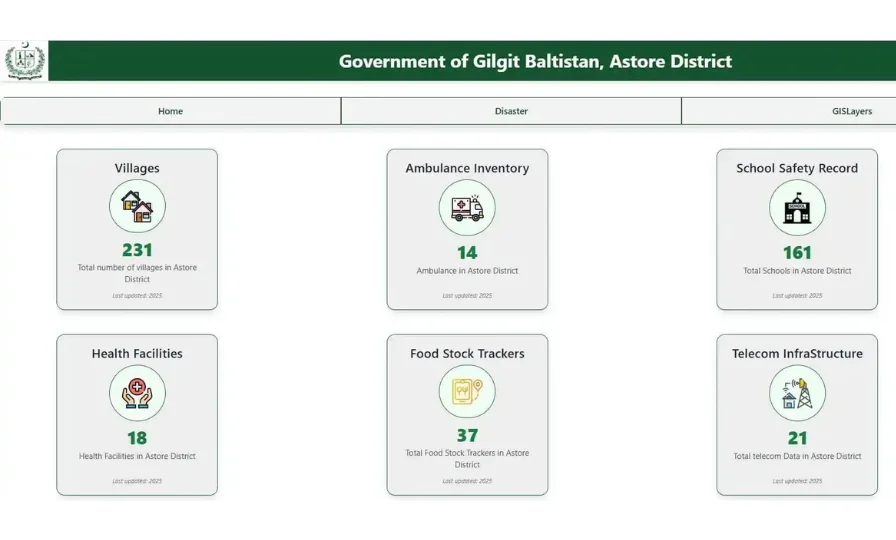
Astore, Gilgit-Baltistan
Web portal with multi-hazard vulnerability and risk layers for the district administration.
Certificate of appreciation, Deputy Commissioner Astore
Hazard modeling connects directly to spatial data, satellite observation and climate analysis.
Our portfolio includes flood mapping and multi-hazard assessments for public authorities and infrastructure.
Our information security management is certified to ISO/IEC 27001.
Each output records the scenario, the input data and the limits of the model.
We use data and models that fit the hazard, the terrain and the available records.
Tell us the problem and the area. We will suggest the simplest way to solve it.
Floods, flash floods, GLOFs, landslides, heat and drought. We can also combine them in a multi-hazard study.
A hazard map shows what could happen and where. A risk map also includes the people and assets exposed and how vulnerable they are. See scenario-based impact assessment.
Any surveys, gauge records, drainage plans and past event reports help. We can fill gaps with satellite and open data, and we state how the gaps affect results.
We compare results with past flood extents, satellite observations, gauge records or field evidence. Where records are limited, we state that clearly.
Yes. Scenario results can define trigger levels and warning zones, and they can connect to live data. See climate risk and early warning.
Yes. We can use climate projections to create future rainfall, temperature or flood scenarios.
Climate Tech Services
What each hazard scenario means for people, assets, services and budgets.
Climate Tech Services
Downscaled climate projections for planning horizons, with uncertainty stated.
Climate Tech Services
Site-level forecasts, alerts and weather data built for one location or network.
Tell us the area, the hazard and the decision. We will reply with a clear plan and a quote.
