| Quick Answer: How Do GIS Specialists Fight Climate Change? A GIS specialist uses maps, satellite imagery, remote sensing, and spatial analysis to identify, monitor, and manage climate risks. By combining geospatial data with tools like ArcGIS, QGIS, and Google Earth Engine, GIS specialists help governments and communities predict floods, site renewable energy projects, track deforestation, and reduce urban heat, turning raw data into climate action. |
GIS specialists are the professionals who turn satellite imagery, elevation data, and climate records into maps that guide flood defenses, renewable energy projects, and disaster response worldwide. As climate risks intensify, from Pakistan’s 2025 monsoon floods to record wildfire seasons in the western United States, demand for geospatial expertise has never been higher.
In this guide, you’ll learn exactly what a GIS specialist does, the tools they rely on, and five concrete ways geospatial data is being used to fight climate change today, including how GIS specialists are helping Pakistan manage flood and glacial lake outburst flood (GLOF) risk. You’ll also get a step-by-step breakdown of the GIS decision-making process, the skills and certifications needed to enter this field, and answers to the questions people ask most about GIS specialist careers.
What Is a GIS Specialist?
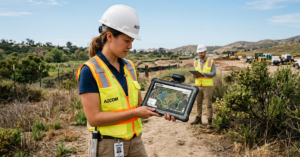
A GIS specialist collects, analyzes, and visualizes location-based data to help organizations understand spatial patterns and make informed decisions. In climate work specifically, GIS specialists monitor deforestation, map flood zones, track temperature trends, plan renewable energy sites, and design more climate-resilient cities.
GIS specialists work across government agencies, environmental consulting firms, renewable energy developers, and NGOs. Core skills include spatial data analysis and cartography, remote sensing and satellite image interpretation, Python and SQL scripting, environmental impact assessment, and dashboard design.
What Is Geospatial Data?
Geospatial data is information linked to a specific location on Earth, including satellite imagery, GPS coordinates, aerial photography, elevation data, and sensor measurements. It can be collected through remote sensing, surveying, GPS, and other mapping technologies. GIS specialists rely on tools including ArcGIS (Esri’s industry-standard mapping software), QGIS (a free, open-source alternative), Google Earth Engine (for large satellite datasets), and the Landsat and Sentinel satellites, which capture continuous imagery of Earth’s surface.
(Source: USGS – What is a GIS?)
GIS vs. Remote Sensing: What’s the Difference?
The two terms are related but not interchangeable. Remote sensing is the process of collecting information about the Earth’s surface without direct physical contact, typically via satellite or aerial sensors. GIS is the broader technology and methodology used to store, integrate, analyze, and visualize that geographically referenced data once it’s been collected. In short: remote sensing gathers the data; GIS is where specialists make sense of it.
GIS vs. Geospatial Intelligence
GIS and geospatial intelligence (GEOINT) are closely related but not identical. GIS refers to the technology and methods used to manage and analyze geographic data. Geospatial intelligence refers to the broader practice of analyzing that geospatial information, often combined with imagery and other contextual data, to support real-world decisions from disaster response to defense and urban planning. Most climate-focused GIS work draws on both.
5 Surprising Ways GIS Specialists Fight Climate Change
Climate change doesn’t affect every region the same way, which is exactly why location-specific geospatial data matters more than global averages. Here are five ways GIS specialists turn that data into action.
1. How GIS Specialists Map Climate Change and Temperature Trends
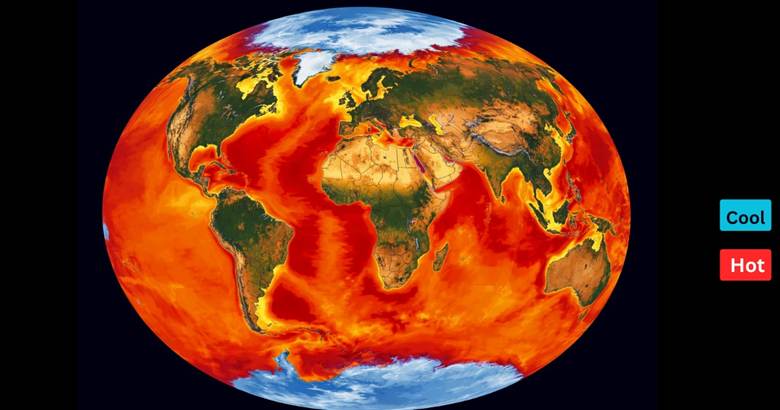
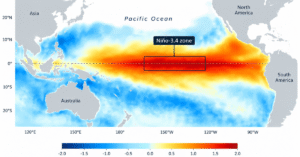
GIS specialists can combine ground observations, satellite-derived data, and other spatial datasets to map temperature patterns and climate risk. NASA’s GISTEMP analysis, for example, uses meteorological station and ocean observations to produce global surface temperature estimates and maps, updated monthly, showing precisely how warming is distributed across the planet rather than as a single global figure, a distinction that also matters for regional events like El Niño, which can shift temperature and rainfall patterns independently of the long-term warming trend. (Source: NASA GISS Surface Temperature Analysis (GISTEMP))
A global average temperature tells you the planet is warming; a temperature map tells you precisely where people are at risk right now.
2. How GIS Specialists Support Flood Risk and Sea Level Rise Mapping
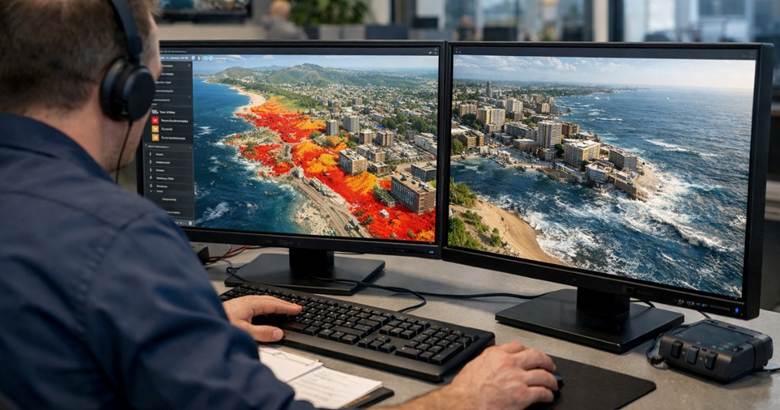
GIS turns complex flood data into clear risk maps. Specialists combine elevation models, rainfall records, and river-flow data to identify flood-prone areas.
They can also model future flood scenarios and plan safer evacuation routes. During active floods, satellite imagery helps teams monitor changing conditions in near real time.
In the United States, FEMA uses GIS to produce flood maps for the National Flood Insurance Program. These maps can influence insurance costs and building requirements for millions of properties.
Mapping the Threat of Rising Seas
Sea-level rise presents another major climate risk. Melting glaciers and expanding ocean water are contributing to rising sea levels worldwide.
GIS helps planners visualize which coastal areas could face greater exposure. Specialists combine elevation data with sea-level rise projections to model potential impacts.
These models can guide coastal defenses, evacuation planning, zoning, and relocation decisions. They also allow planners to identify high-risk areas before flooding becomes an immediate threat.
The Netherlands provides a strong example of this approach. Dutch water management authorities use 3D digital twins of coastlines to simulate storm surges.
These digital models help test dykes, evacuation routes, and coastal protection strategies under different sea-level rise scenarios.
Key takeaway: GIS does more than show where flooding may occur. It helps decision-makers understand risk, test possible responses, and plan before disaster strikes.
3. How GIS Specialists Identify Ideal Sites for Solar and Wind Projects
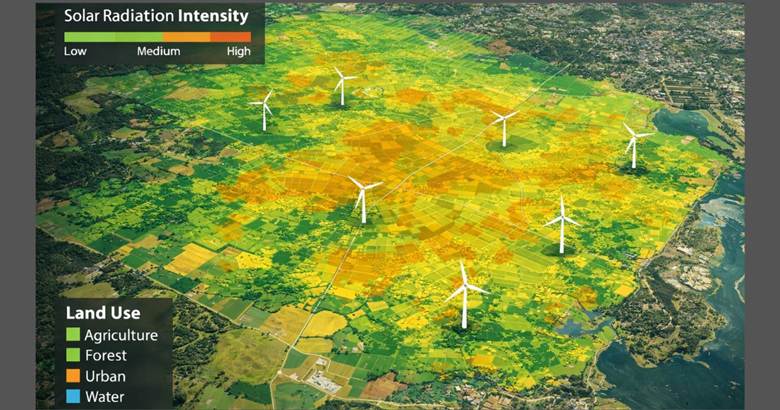
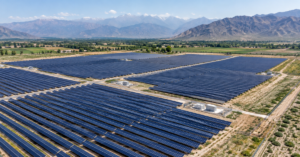
GIS specialists combine solar and wind data with land-use, environmental, and grid-connectivity maps. This helps identify productive locations while reducing environmental and infrastructure challenges.
Where a solar farm or wind turbine is placed matters enormously. A poorly sited project may generate less energy than expected. A well-planned site can improve energy output while reducing construction, connection, and environmental costs.
GIS specialists typically follow five key steps:
- Solar radiation analysis: Mapping solar irradiance across target regions using satellite data to identify suitable locations for solar panels.
- Wind pattern mapping: Analyzing wind speed and direction at different altitudes to identify reliable wind corridors.
- Land-use classification: Overlaying environmental, agricultural, and protected-area maps to avoid sensitive ecosystems and farmland.
- Grid connectivity analysis: Mapping proximity to existing power infrastructure to reduce connection costs.
- Community and accessibility assessment: Checking roads and service infrastructure required for construction and maintenance.
GIS-based spatial planning is widely used in large-scale renewable energy programs, including Germany’s Energiewende. These approaches help assess renewable energy potential, land-use constraints, environmental sensitivity, and grid access together.
Similar spatial planning approaches have been used in desert regions of the southwestern United States. They help identify high-potential solar sites while avoiding sensitive desert ecosystems.
This is precision energy planning. GIS specialists can analyze sunlight, wind, land use, grid access, and environmental sensitivity together on the same map.
4. How GIS Specialists Track Deforestation and Carbon Emissions
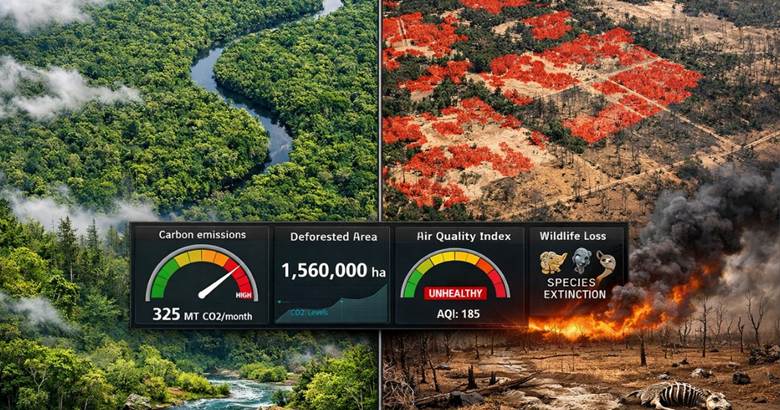
Forests are among the planet’s most important carbon sinks. GIS specialists use satellite imagery, remote sensing, and LiDAR (which measures vegetation structure across multiple canopy layers) to detect deforestation as it happens, map illegal logging in hard-to-reach protected areas, and estimate carbon stored in forest biomass.
Global Forest Watch, run by the World Resources Institute, gives governments, NGOs, and journalists a shared, near-real-time view of forest loss worldwide. In Brazil, satellite monitoring by the National Institute for Space Research (INPE), through its PRODES program, showed the country’s annual Amazon deforestation rate staying above 10,000 km² every year between 2019 and 2022, evidence used in enforcement and international policy debate. This type of forest monitoring can also provide important data for forest carbon accounting and REDD+ monitoring, reporting, and verification.
(Sources: Global Forest Watch; Pesquisa FAPESP; INPE/PRODES Amazon monitoring)
5. How GIS Specialists Reduce Urban Heat Islands
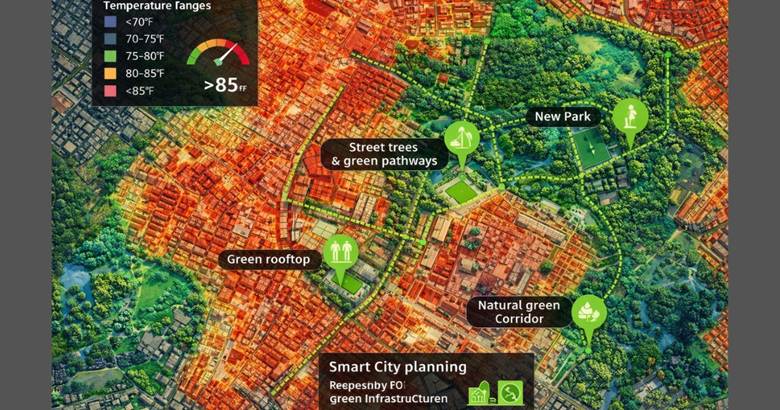
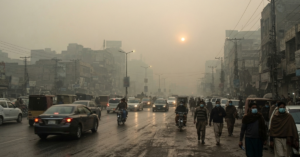
Concrete, asphalt, and dark rooftops absorb heat during the day. They release this heat at night.
This creates the urban heat island effect. It can pose a serious health risk to elderly residents and low-income communities. Outdoor workers can also face increased heat exposure. GIS specialists map surface temperatures and tree canopy coverage.
This helps identify the hottest and least-shaded neighborhoods. They can then model where new trees, green roofs, and parks could provide cooling. GIS specialists can also layer demographic data into these analyses. This helps prioritize the most vulnerable areas for climate action.
How GIS Specialists Are Tackling Climate Risk in Pakistan
Pakistan is one of the clearest examples of why location-specific GIS work matters. During the 2025 monsoon floods in Punjab, a geospatial impact assessment using Sentinel-1 satellite imagery found that Sialkot and Narowal districts had among the highest shares of flooded cropland in the province, about 25% and 18%, respectively, even through cloud cover, helping identify which low-lying farmland and riverbanks were hit hardest. This kind of rapid satellite-based mapping is part of the same AI in Disaster Management toolkit used across South Asia’s flood-prone regions.
(Source: FAO Flood Impact Assessment in Punjab, 2025)
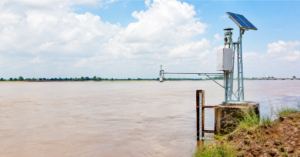
In the country’s north, glacial lake outburst floods (GLOFs) present a related but distinct hazard. GIS and remote sensing technologies support GLOF risk monitoring and early warning efforts in Gilgit-Baltistan and Khyber Pakhtunkhwa, including automated weather stations and early warning systems installed under Pakistan’s UNDP-backed GLOFII project across dozens of vulnerable valleys, tracking glacial lake expansion to help warn downstream communities before a breach occurs. This mix of flood mapping, remote sensing, and disaster risk planning is exactly the kind of geospatial work that makes Pakistan’s climate challenges distinct from the global examples covered above.
(Source: UNDP Pakistan GLOFII Project)
Case Study: LA GeoHub
The problem: Los Angeles is California’s largest urban heat island, and city agencies needed a way to see which neighborhoods faced the highest heat exposure with the least tree cover, since that data was scattered across separate departments.
The GIS response: LA GeoHub, the city’s open geospatial data platform, brings together surface temperature mapping with demographic and tree canopy data in one place, letting agencies visualize heat exposure and community vulnerability together rather than as separate datasets. That analysis has supported city and partner efforts, including a Google/Cal State LA tree canopy mapping initiative, to prioritize tree planting in the neighborhoods with the highest heat exposure and the least existing canopy. (Source: Esri StudentLed Mapping Locates Areas in LA in Need of Shade Equity)
Five GIS Applications at a Glance
| GIS Application | Data Used | What GIS Does | Climate Benefit |
| Climate & temperature mapping | Weather station records + satellite thermal imagery | Maps warming patterns across regions | Identifies vulnerable regions for adaptation investment |
| Flood & sea-level rise risk mapping | Elevation models, rainfall, river flow, satellite imagery | Models flood risk and future scenarios | Supports evacuation and infrastructure planning |
| Renewable energy site selection | Solar/wind data + land use maps | Identifies optimal, low-impact sites | Supports clean energy development |
| Forest loss & carbon monitoring | Satellite imagery + LiDAR | Detects and measures forest loss | Supports conservation and carbon finance verification |
| Urban heat mapping & cooling planning | Thermal imagery + tree canopy data | Maps heat islands and cooling potential | Guides tree planting and cooling strategies |
Why Spatial Data Changes Climate Decisions
Two cities can experience the same average temperature increase and still face very different levels of risk, because population density, tree cover, building materials, elevation, and access to cooling infrastructure all vary by location. A citywide average doesn’t tell you which neighborhood needs shade first or which street is most likely to flood. This is the core value GIS specialists bring: they replace broad averages with location-specific evidence, so decision-makers can direct adaptation resources where they’re actually needed.
The GIS Decision-Making Process
• 1. Collect: gather satellite imagery, sensor data, and ground records
• 2. Map: process raw data into spatial layers in GIS software
• 3. Analyze: apply spatial analysis to identify patterns and risk zones
• 4. Model: build scenarios (flood extent, heat spread, forest loss)
• 5. Decide & Monitor: feed results into risk assessments and track outcomes over time
Challenges GIS Specialists Face in Climate Work
• Data gaps in developing countries: limited weather station networks and incomplete datasets
• High costs for commercial GIS licenses and premium satellite imagery
• A shortage of GIS professionals with climate-specific expertise
• Interdisciplinary complexity: close collaboration with scientists, planners, and policymakers is required
• Data quality and interoperability: datasets from different sources often use different formats, scales, resolutions, or coordinate systems, which complicates integration
The Future of GIS in Climate Action
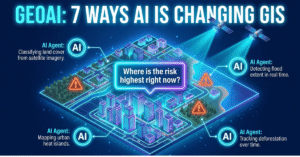
AI and machine learning are increasingly integrated with GIS platforms to automate deforestation detection, flag emerging flood risk, and improve temperature forecasting, an approach often called GeoAI. In practice, the AI typically detects patterns in the raw imagery, and a GIS specialist validates those patterns, interprets them in local spatial context, and turns them into information decision-makers can act on. Cloud platforms such as ArcGIS Online and Google Earth Engine now process massive geospatial datasets at a scale that would have been impractical a decade ago, while drone-based remote sensing adds highly detailed imagery alongside satellite observations. “4D GIS,” which adds a time dimension to spatial analysis, lets specialists model how landscapes may change under different climate scenarios over decades.
Platforms that combine GIS, remote sensing, AI, and environmental datasets, including AI Geo Navigators, are extending this work further, making complex geospatial information easier to analyze and apply to climate risk decisions.
The U.S. Bureau of Labor Statistics projects 6% employment growth for surveying and mapping technicians, and 6% growth for cartographers and photogrammetrists from 2024 to 2034, related occupational categories that point to steady demand for geospatial skills.
(Source: U.S. Bureau of Labor Statistics, Occupational Outlook Handbook)
Conclusion
GIS lets specialists combine location data with climate, demographic, and environmental information. They can then analyze and model these datasets. This makes GIS valuable for climate action in ways that static maps alone cannot achieve. These five applications are already in use worldwide.
They include climate mapping, flood and sea-level rise risk mapping, renewable energy site selection, deforestation monitoring, and urban heat mapping. Government agencies and research institutions use these applications today. Pakistan’s flood and GLOF monitoring provides a clear local example of these principles in action.
As GIS, remote sensing, and AI continue to converge, platforms like AI Geo Navigators are helping turn that geospatial data into decisions communities can act on. Explore the related reads below to see how these same principles apply to flood forecasting and disaster response in Pakistan.
FAQs
What does a GIS specialist do?
A GIS specialist collects, analyzes, and maps location-based data. In climate work, that means monitoring deforestation, mapping flood zones, tracking temperature trends, and planning renewable energy sites using tools like ArcGIS, QGIS, and Google Earth Engine.
How does GIS help fight climate change?
GIS helps identify the best locations for renewable energy installations, monitors forest carbon sinks in near real time, tracks land use change through satellite imagery, and guides urban planning that reduces energy consumption and heat exposure.
Are GIS specialists in demand?
Yes. Related geospatial occupations are projected to keep growing through 2034 according to U.S. labor market data, and demand is rising globally as more governments and companies invest in climate risk mapping and renewable energy planning.
Where do GIS specialists work?
GIS specialists work across government agencies (such as NASA, NOAA, and local planning departments), international organizations (the UN Environment Programme, World Bank), environmental consulting firms, renewable energy developers, and conservation-focused NGOs.
Can GIS specialists work in climate and disaster management?
Yes. GIS specialists work alongside meteorologists, hydrologists, and disaster management agencies to map flood, GLOF, and heat risk, and to plan evacuation routes and early warning systems, using the same skill set covered throughout this guide.
What is the difference between GIS and remote sensing?
Remote sensing is the process of collecting information about the Earth’s surface via satellite or aerial sensors, without direct physical contact. GIS is the broader technology used to store, integrate, analyze, and visualize that data once it’s collected. Remote sensing gathers the data; GIS is where specialists make sense of it.
About the Author
Nosheen Ishaq is an SEO content strategist and GEO/AEO specialist who writes on climate technology, geospatial analysis, and environmental topics for AI Geo Navigators.