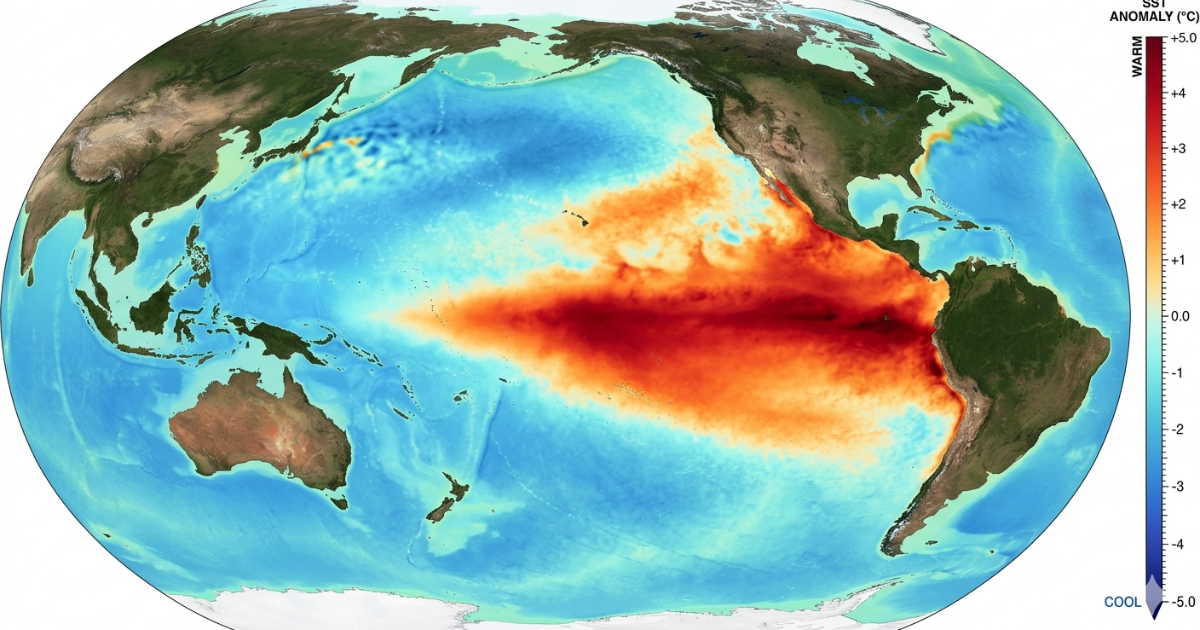
| El Niño is a natural climate pattern caused by unusually warm sea-surface temperatures in the central and eastern tropical Pacific Ocean. It weakens the trade winds, shifts atmospheric circulation, and is associated with drought in some regions and heavy rainfall or flooding in others. |
El Niño is a natural climate pattern and the warm phase of the El Niño–Southern Oscillation (ENSO). It occurs when sea-surface temperatures in the central and eastern tropical Pacific become unusually warm for months at a time, weakening trade winds, shifting atmospheric circulation, and influencing rainfall and temperature patterns far beyond the Pacific.
El Niño develops irregularly, typically every 2 to 7 years, and an episode usually lasts 9 to 12 months. Against a warming global climate, El Niño can contribute to exceptionally high global temperatures, as seen during the 2023–24 episode.
You may have heard about El Niño in a weather forecast. But do you clearly understand what it means for your community, your food security, and your daily life? This article explains the science behind El Niño, its real-world impacts, the technology used to monitor it, and how communities can prepare.
| Key Takeaways El Niño is the warm phase of the El Niño–Southern Oscillation (ENSO). What causes it: Weakened trade winds allow warm Pacific surface water to shift eastward. How often it occurs: Approximately every 2 to 7 years. How long it lasts: Typically 9 to 12 months. Main risks: Drought, flooding, heatwaves, food insecurity, and disrupted water supplies. Pakistan: El Niño tends to be associated with below-normal South Asian monsoon rainfall, although impacts vary. How it is monitored: Satellites, ocean observations, climate models, GIS, and statistical/AI techniques. How to prepare: Use forecasts, early-warning systems, risk maps, and climate-resilience planning. Current status: A strong El Niño is developing as of August 2026 and is expected to strengthen further during August–October, with the intensification trajectory peaking around November 2026. |
| Current Status: A Strong El Niño Is Developing Now (August 2026) This is not a hypothetical cycle. The World Meteorological Organization’s Global Seasonal Climate Update reports that a strong El Niño is developing and is expected to strengthen during August–October 2026, with seasonal-average sea-surface temperature anomalies forecast to reach approximately 2.9°C in key Pacific monitoring regions. NOAA’s August 13, 2026 ENSO Diagnostic Discussion gives a greater than 90% chance of a very strong event during Northern Hemisphere fall and winter 2026–27. The UN World Food Programme has also projected that the 2026–27 El Niño could push at least 49 million more people into acute food insecurity across 45 vulnerable countries by the end of 2027, highlighting the potential for significant food-security impacts as the event develops. (WMO, July 2026) |
What Exactly Is El Niño?
El Niño is the warm phase of the El Niño–Southern Oscillation (ENSO), a recurring climate pattern involving interactions between the tropical Pacific Ocean and the atmosphere. It begins when sea-surface temperatures in the central and eastern tropical Pacific become unusually warm, disrupting normal ocean-atmosphere circulation and influencing weather patterns far beyond the Pacific.
The name “El Niño” comes from Peruvian fishermen, who observed unusually warm coastal waters around Christmas. They used the Spanish term “El Niño,” meaning “The Little Boy” or “The Christ Child.” Today, scientists recognize El Niño as one phase of the broader ENSO cycle, alongside La Niña and the neutral phase.
What Causes El Niño?
El Niño develops through a chain of ocean-atmosphere changes in the tropical Pacific. In broad terms:
- The trade winds, which normally blow from east to west across the Pacific, weaken.
- Warm surface water that is usually pushed toward Asia and Australia spreads back eastward, toward South America.
- The thermocline, the boundary between warm surface water and cold deep water, flattens, reducing the upwelling of cold, nutrient-rich water off South America’s coast.
- This ocean warming alters atmospheric pressure and rainfall patterns above the Pacific.
- The changes then ripple outward through global wind and jet-stream patterns, known as teleconnections, which is how a shift in the Pacific ends up affecting rainfall in Africa, Asia, and the Americas.
This full sequence is why El Niño is described as an ocean-atmosphere phenomenon rather than a purely oceanic one.
How the Pacific Ocean Controls Global Weather
Under normal conditions, trade winds blow westward across the Pacific. These winds push warm surface water toward Australia and Indonesia, while cooler water rises along the coast of South America.
During El Niño, the trade winds weaken and sometimes reverse. Warm water spreads eastward across the Pacific. This shift in ocean temperature alters atmospheric circulation and sets off chain reactions in weather patterns from Asia to the Americas.
El Niño vs La Niña: Understanding the Full ENSO Cycle
El Niño doesn’t work by itself. It is one phase of a bigger back-and-forth climate machine. La Niña is the opposite of El Niño, when Pacific Ocean temperatures fall below average. Together, these two patterns make up the ENSO cycle.
Here is how they compare:
| Factor | El Niño | La Niña |
| Pacific Ocean Temp | Above normal, warm | Below normal, cool |
| Trade Winds | Weakened or reversed | Strengthened |
| Australia / Indonesia | Drought conditions | Heavy rainfall and floods |
| South America | Heavy rainfall and floods | Drier than normal |
| India Monsoon | Weakened, below normal | Strengthened, above normal |
| Pakistan / South Asia | Irregular monsoon | Stronger monsoon |
| Global Temperature | Rises, warmest years | Slightly cooler globally |
| Typical Duration | 9 to 12 months | 9 to 12 months |
| Frequency | Every 2 to 7 years | Every 2 to 7 years |
Most importantly, neither phase is inherently good or bad. Both cause extreme weather events. But El Niño years tend to coincide with some of the highest global temperatures on record, which is why scientists watch them closely.
How Is El Niño Predicted?
ENSO conditions are forecast by combining several independent data streams rather than any single measurement:
- Sea-surface temperature readings from moored and drifting ocean buoys across the tropical Pacific
- Satellite observations of ocean height, temperature, and cloud cover
- Atmospheric pressure differences across the Pacific, known as the Southern Oscillation Index
- Trade-wind strength and direction
- Coupled ocean-atmosphere climate models that project how current conditions are likely to evolve
- Statistical and machine-learning models that compare current conditions against historical ENSO episodes
Meteorological agencies typically issue ENSO outlooks 6 to 12 months ahead, with confidence improving as the event develops. This lead time is what allows governments and agricultural planners to prepare before impacts peak, rather than react after them.
What Are the Real-World Impacts of El Niño?
The phenomenon does more than warm the ocean. It reorganises rainfall, shifts monsoon patterns, intensifies drought in some regions, and increases the likelihood of heavy rainfall and storm activity in others.
The 1997–98 episode, one of the strongest on record at the time, is estimated to have caused more than 22,000 deaths and over $36 billion in damages from El Niño-related flooding and drought across Africa, Latin America, North America, and Southeast Asia.
The 2023–24 episode coincided with record global temperatures and contributed to severe flooding in multiple regions. According to the World Meteorological Organisation, 2024 was the first calendar year in which global average temperature exceeded 1.5°C above the pre-industrial average, though a single year crossing that mark is not the same as the Paris Agreement’s long-term threshold being breached, which is assessed over a multi-year average.
How Does El Niño Affect Food Security?
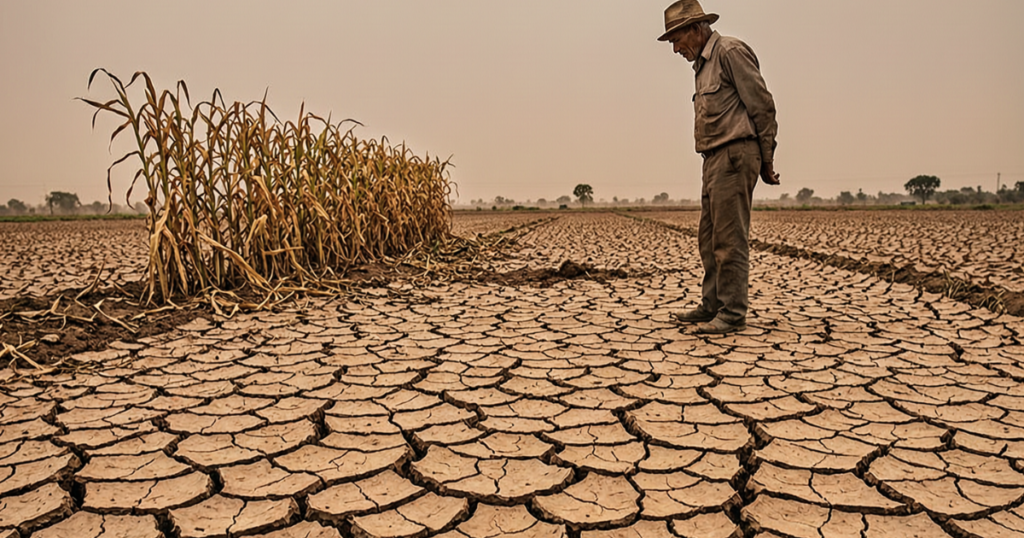
El Niño is associated with intensified drought across Southern Africa, South Asia, and Australia. Crops can fail, water reserves can deplete, and food prices can spike as a result.
During the 2015–16 episode, the agriculture, food security, and nutritional status of roughly 60 million people worldwide were affected by El Niño-related droughts, floods, and extreme temperatures (FAO/WFP, 2016 situation report).
WFP’s August 2026 analysis projects that the strengthening 2026–27 El Niño could push at least 49 million more people into acute food insecurity across 45 vulnerable countries by the end of 2027. Highlighting how food-security risks can build well before the event reaches peak intensity.
Preparing agricultural systems for these cycles is increasingly treated as essential rather than optional. Satellite-based soil-moisture monitoring and AI-assisted irrigation planning are among the tools now available to farming communities facing more intense drought cycles.
Floods and Extreme Rainfall
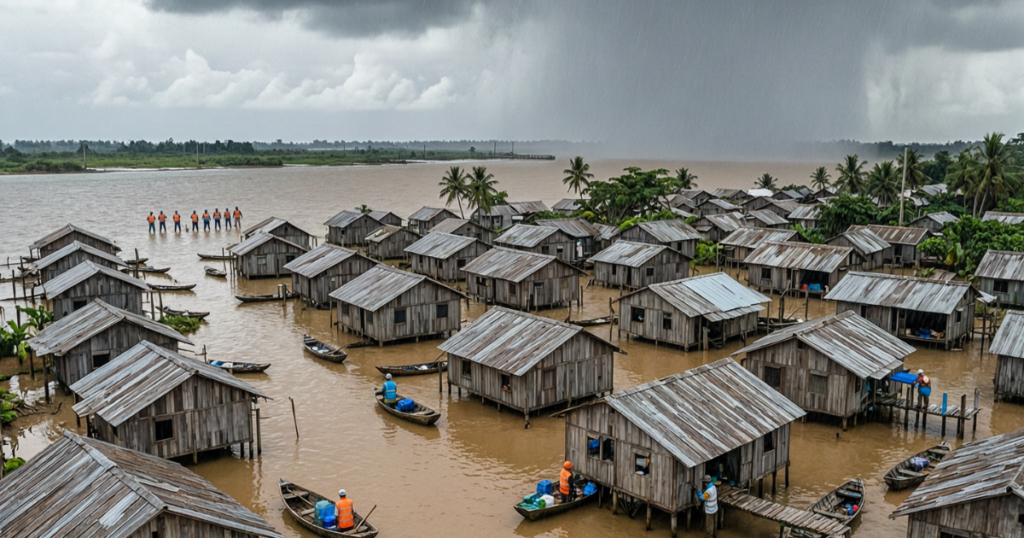
While some regions dry out, others see the opposite. El Niño is linked to a higher likelihood of heavy flooding in South America, East Africa, and parts of the southern United States. In 2024, severe flooding affected regions including Brazil, Kenya, and the United Arab Emirates, highlighting the complex interaction between climate patterns, extreme rainfall, and local vulnerability.
Flood-risk management becomes more complex in El Niño years, as rivers overflow faster and drainage systems come under greater strain. Urban areas without climate-resilient infrastructure tend to be affected most. GIS mapping services and geospatial flood risk tools help identify which communities face the highest exposure before floodwaters arrive.
Heatwaves and Human Health
El Niño can increase the likelihood or intensity of heat extremes in some regions. It can add temporary warming to an already-warming climate. During the 2023 to 2024 episode, warmth records fell on every inhabited continent.
Separately, climate change contributed to at least 3,700 deaths and displaced millions of people across 26 (of 29 studied) extreme-weather events analysed in 2024, and added an average of 41 extra days of dangerous heat worldwide that year (World Weather Attribution & Climate Central, “When Risks Become Reality,” Dec 2024).
According to Aon’s 2026 Climate and Catastrophe Insight report, extreme heat was responsible for more than 25,000 deaths globally in 2025, the third-hottest year on record, underscoring the growing risk posed by extreme heat without urgent action.
Heat-related mortality can rise sharply during prolonged periods of extreme heat. Elderly populations, outdoor workers, and groups without air conditioning face the greatest risk. Climate resilience strategies combining early heat alerts, urban cooling centres, and green infrastructure can significantly reduce these deaths if deployed before the next event.
How Does Climate Change Affect El Niño Impacts?
El Niño is a natural climate phenomenon, while climate change is driven primarily by human greenhouse-gas emissions. They are different processes, but their effects can compound. When El Niño adds temporary warming to an already warmer global climate, it can contribute to exceptionally high temperatures and intensify certain drought, heat, and rainfall extremes.
Human-caused climate change has already raised global temperatures substantially above the pre-industrial average, while individual years can temporarily exceed 1.5°C. When El Niño adds temporary warming to this higher baseline, it can push global temperatures to exceptionally high levels. Drought conditions can become more severe, flood impacts can increase, and heatwaves can become more dangerous.
World Weather Attribution’s analysis of the April 2024 South Asia heatwave found the extreme temperatures were made roughly 45 times more likely and about 0.85°C hotter because of human-caused warming, a scale of influence that varied by region and event, and that sits alongside, rather than separate from, El Niño’s own contribution. Therefore, effective climate-risk planning must account for both natural ENSO variability and the risks amplified by human-caused warming.
How Real-Time Technology Is Changing El Niño Preparedness
Satellite-based remote sensing services now track sea-surface temperatures, atmospheric moisture, and rainfall anomalies in near real time, giving scientists and governments weeks to months of advance warning before impacts peak.
- Satellite monitoring: continuous tracking of ocean temperature, cloud patterns, and rainfall anomalies
- Climate models: coupled ocean-atmosphere models that project how ENSO conditions are likely to evolve
- GIS and geospatial risk mapping: layering flood, drought, and heat exposure data over population and infrastructure maps
- AI and machine learning: models that process large volumes of ocean, atmospheric, and satellite data to sharpen forecasts and flag emerging risk patterns
This is the same machinery now tracking the 2026 event in real time; WMO’s monthly Global Seasonal Climate Update, NOAA’s Climate Prediction Center advisories, and satellite sea-surface-temperature monitoring together produced the high-confidence forecast described earlier in this article.
AI and machine-learning models complement traditional climate forecasting rather than replace it. Real-time vision AI models are particularly useful further downstream, for example, detecting floods, monitoring crop stress, and tracking landscape change from satellite imagery, rather than as the primary tool for predicting ENSO intensity itself.
Is your community, business, or government prepared for the next El Niño cycle?
Discover how AI-powered geospatial and climate intelligence tools are supporting governments and organizations around the world to map dangers, protect vulnerable communities, and build genuine climate resilience. Climate intelligence tools are helping governments and organisations better understand risks and prepare for future El Niño events before the next cycle arrives.
Who Is Most Vulnerable to El Niño?
El Niño does not affect everyone equally. Low- and middle-income countries tend to bear the heaviest burden; they contribute least to climate change but absorb some of its most severe impacts.
Small island states face existential flooding risk. Sub-Saharan African communities face food-system disruption from drought. South Asian farming communities face monsoon failure. Within any given country, women, children, the elderly, and people living in poverty tend to face the steepest risks, since they typically have the least access to early warnings, financial safety nets, and recovery resources.
Spatial risk intelligence is one of the most powerful tools we have for protecting individuals who can’t defend themselves.
How Does El Niño Affect Pakistan?
It is generally associated with below-normal South Asian monsoon rainfall, but the relationship isn’t deterministic. La Niña, the opposite phase, tends to be associated with stronger monsoon rainfall in parts of South Asia. However, individual floods result from multiple interacting factors, including rainfall intensity, topography, land use, infrastructure, and atmospheric conditions.
Because El Niño and La Niña can influence Pakistan’s water security, agriculture, and disaster preparedness in different ways, tracking ENSO forecasts is an important part of national water management and climate-risk planning. For a detailed look at how these cycles are playing out in Pakistan specifically, see El Niño Crisis in Pakistan: How AI GEO Fights Back.
How to Prepare for El Niño
Preparation is straightforward, but it should begin well before the effects of El Niño peak. Here is what helps at every level.
As an individual or household:
- Monitor your national meteorological authority and local weather service for regular ENSO and seasonal weather updates.
- Build a 72-hour emergency package with water, food, medications, and a battery-powered radio
- Know your flood risk area and your evacuation route before you need them
- Check on aged neighbours during heatwaves, as they face the highest mortality risk
- Reduce water use during drought years to conserve community reserves
As a business or organisation:
- Commission a geospatial climate risk assessment to identify your specific exposure
- Stress-test your supply chains against drought, flood, and heat scenarios simultaneously
- Invest in renewable energy to reduce both your emissions and your energy cost volatility
- Develop a business continuity plan that addresses El Niño-specific disruption scenarios
As a policymaker or government official:
- Integrate forecasts into national disaster preparedness budgets at least 12 months in advance
- Mandate multi-hazard risk maps for every municipality using geospatial data tools
- Prioritise early warning system investment: WMO and UNDRR’s Early Warnings for All initiative estimates these systems deliver close to a tenfold return on investment, and a 24-hour advance warning alone can cut resulting damage by around 30% (UNDRR/Global Commission on Adaptation).
- Build drought-resistant agricultural infrastructure in food-vulnerable regions before the next cycle
Conclusion
El Niño is a recurring feature of the global climate system, but its impacts can vary significantly by region. It can influence rainfall, temperatures, agriculture, water availability, food security, and the risk of droughts or floods. Understanding these effects helps communities and decision-makers prepare for potential disruptions.
Forecasting, satellite monitoring, GIS-based risk mapping, and AI-assisted analysis can provide valuable lead time to prepare for El Niño-related risks. By combining reliable climate forecasts with local risk data and early-warning systems, communities can reduce their vulnerability and respond more effectively. The key is turning climate information into action before impacts peak.
FAQs
What is El Niño in simple terms?
El Niño is a natural climate pattern in which sea-surface temperatures in the central and eastern tropical Pacific Ocean become warmer than normal for several months. This warming disrupts atmospheric circulation and can influence weather patterns around the world, contributing to drought in some regions and heavy rainfall or flooding in others. El Niño typically occurs every 2 to 7 years and usually lasts 9 to 12 months. El Niño is a natural climate pattern, but a warmer global climate can amplify some of the heat, rainfall, and drought extremes associated with El Niño.
What causes El Niño?
El Niño begins when the trade winds that normally blow westward across the Pacific weaken or reverse. Warm water then spreads eastward across the ocean. This shift in sea-surface temperature triggers changes in rainfall patterns, storm tracks, and temperature across the globe. Scientists monitor sea-surface temperatures and wind patterns to detect it months in advance.
How is El Niño different from La Niña?
El Niño and La Niña are opposite phases of the ENSO cycle. El Niño brings warmer-than-normal Pacific temperatures, associated with drought in Australia and heavier rainfall in South America. La Niña brings cooler temperatures and broadly the opposite regional effects. El Niño years often coincide with some of the highest global temperatures on record; La Niña years tend to be slightly cooler.
How long does El Niño last?
A typical episode lasts between 9 and 12 months, though some strong episodes have lasted up to 18 months. The 1997–98 El Niño was one of the longest and most intense on record, linked to more than 22,000 deaths and over $36 billion in damages worldwide (NOAA Office of Global Programs). Scientists typically issue forecasts 6 to 12 months in advance, giving communities time to prepare.
How often does El Niño occur?
El Niño occurs every 2 to 7 years, though the timing is irregular and not perfectly predictable. Some decades see more frequent events than others. Scientists are still studying whether climate change is altering the frequency or intensity of these cycles.
What are the worst effects of El Niño?
The most severe impacts include catastrophic flooding in South America and East Africa, extreme drought in Australia, Indonesia, and South Asia, weakened monsoons that reduce crop yields, dangerous heatwaves, and intensified wildfire risk.
Is El Niño getting worse because of climate change?
Climate change does not cause El Niño, but a warmer global climate can amplify some of the heat, rainfall, and drought extremes associated with El Niño. When El Niño adds further warming on top of an already-warm climate, it can contribute to more extreme temperatures and can amplify some heat, rainfall, and drought impacts.
Which countries are most affected by El Niño?
Countries commonly affected include Peru, Ecuador, and Brazil in South America; Australia, Indonesia, and the Philippines in the Pacific; India, Pakistan, and Bangladesh in South Asia; and Kenya, Ethiopia, and Zimbabwe in Africa. El Niño affects weather in every region to varying degrees; no country is fully insulated from its effects.
What is the difference between El Niño and global warming?
El Niño is a natural, cyclical ocean-temperature variation. Global warming is a long-term trend driven by human greenhouse-gas emissions. El Niño raises global temperatures temporarily for a year or two; global warming raises them cumulatively over time. Together, they can produce compound heat events more extreme than either would produce alone.
How does El Niño affect food prices?
It can disrupt agricultural production across multiple continents at once; drought in Australia can reduce wheat and rice exports, monsoon failures in South Asia can reduce rice production, and flooding in South America can damage soybean and coffee harvests. As supply drops across several crops simultaneously, global food prices can rise, with low-income households hit hardest.
Can we predict El Niño in advance?
Yes. Scientists can typically forecast the onset of an episode with reasonable confidence 6 to 12 months ahead. Meteorological agencies issue regular ENSO outlooks, and satellite monitoring of sea-surface temperatures and atmospheric conditions has improved forecast accuracy considerably since the 1990s. AI and machine-learning techniques are increasingly being used alongside traditional climate models to analyse large datasets and improve climate-risk monitoring and forecasting.
What is the ENSO cycle?
ENSO stands for El Niño–Southern Oscillation. It is the full climate system that includes El Niño, La Niña, and the neutral phase between them. The “Southern Oscillation” refers to the atmospheric pressure shifts over the Pacific that accompany ocean-temperature changes. Together, the ocean and atmospheric components make up one of the most powerful drivers of year-to-year global climate variability.
How can I prepare for El Niño?
Build a 72-hour emergency kit, know your local flood and drought risk, and follow your national meteorological service for ENSO forecasts. Farmers should plan irrigation and planting schedules around drought projections. Businesses should stress-test supply chains against flood, drought, and heat scenarios. Government officials should prioritise early-warning systems and multi-hazard risk mapping before the next cycle peaks.
How does AI help with El Niño prediction and response?
AI and machine-learning models analyse large volumes of ocean, atmospheric, and satellite data to sharpen forecasts and surface patterns traditional models can miss. AI-assisted geospatial platforms also help governments map which communities face the highest risk from floods, droughts, and heatwaves, and computer vision tools are increasingly used for downstream monitoring, such as detecting flood extent or crop stress from satellite imagery.