We map your roads, networks and facilities, monitor sites by drone and connect it all to 3D views, dashboards and automated reports. Managers see what they own, what condition it is in and which assets face hazards.
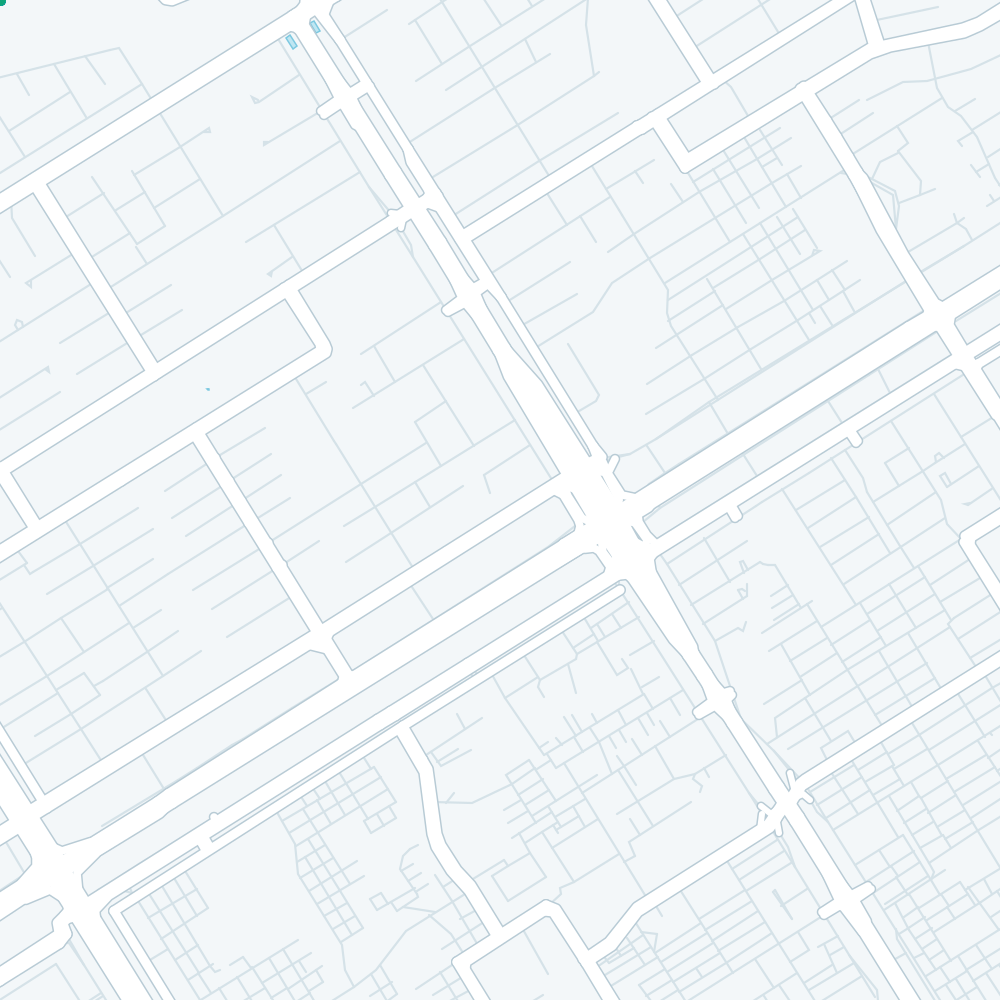
Imagery: Sentinel-2 cloudless 2023 by EOX IT Services, modified Copernicus Sentinel data (CC BY 4.0). Terrain: SRTM via AWS Terrain Tiles. Roads and buildings: © OpenStreetMap contributors (ODbL).
Each service works alone, but they work best as one system: assets captured once, then reused for monitoring, analysis and reporting.
Roads, pipes, cables, poles and facilities captured as one GIS asset register, with the condition and ownership details you need.
Repeat UAV flights that track progress, earthworks and ground change on active sites, as on our Al Jubail project.
Terrain, buildings and assets shown in 3D and linked to your asset data, so managers can inspect a site from a desk.
Routes, travel times and service coverage calculated across road and utility networks, showing gaps and weak links.
Flood, slope and seismic hazards overlaid on your assets to show which roads, plants and lines are most at risk.
Scheduled reports and alerts generated straight from the asset database, so routine status updates stop being manual work.
Teams that own or run physical assets and need an accurate picture of them, without sending a crew out for every question.
One map of roads, drains, lights and facilities, so departments plan works together instead of digging the same street twice.
Drone progress surveys and topographic data for active sites, as in our ongoing work for Desert Line International in Al Jubail.
Hazard maps for public facilities, such as our assessment of the Budalas hydropower site for PWD Gilgit.
Network maps, tracing and condition records that help crews find assets quickly and plan repairs by priority.
We start with the data you already hold and the questions your teams ask every week, then automate only the tasks that save real time.
We review what you hold: drawings, registers, past surveys and the systems your teams use.
Asset data gap report
Drone flights, GNSS survey and satellite imagery fill the gaps and update old records.
Current asset base map
Assets, networks, terrain and hazards joined in one spatial database with a 3D view.
Asset database and 3D view
Dashboards, alerts and scheduled reports set up around the decisions each team makes.
Dashboards and reports
Hosted on our cloud or your servers, with updates and training for your staff.
Hosted system and training
Tell us what you manage, where it is and how you track it today. We will suggest a first phase and a quote.
