We design maps for reports, plans, atlases and screens. Each one has a clear purpose, a readable legend and data you can trace, so a minister, an engineer or a resident understands it the first time.
 N01.53 km33°44′N73°02′E
Imagery: Sentinel-2 cloudless 2023 by EOX IT Services, modified Copernicus Sentinel data (CC BY 4.0). Terrain: SRTM via AWS Terrain Tiles. Roads and buildings: © OpenStreetMap contributors (ODbL).
1,045km²
of August 2025 flooding mapped from Sentinel-1 radar
41,368
land parcels mapped for Gujranwala District records
3
multi-hazard risk assessments, from district to site scale
30+
projects delivered across climate, GIS, AI and ESG
We choose scale, symbols and layout for the reader, then check every map against its source data before it leaves our hands.
Hazard, land use, population and environmental maps that make one pattern clear without burying it in detail.
Contours, drainage, roads and settlements drawn from survey, drone and elevation data at the scale you need.
Consistent sets of maps for EIAs, risk assessments and atlases, with the same layout, symbols and numbering throughout.
Web pages that walk readers through a place, mixing maps, photos, charts and short text in sequence.
Elevation models and drone data shown in 3D, so slopes, valleys and structures are easy to grasp.
Final files prepared for the press, the screen and the web, with fonts, colors and resolution checked.
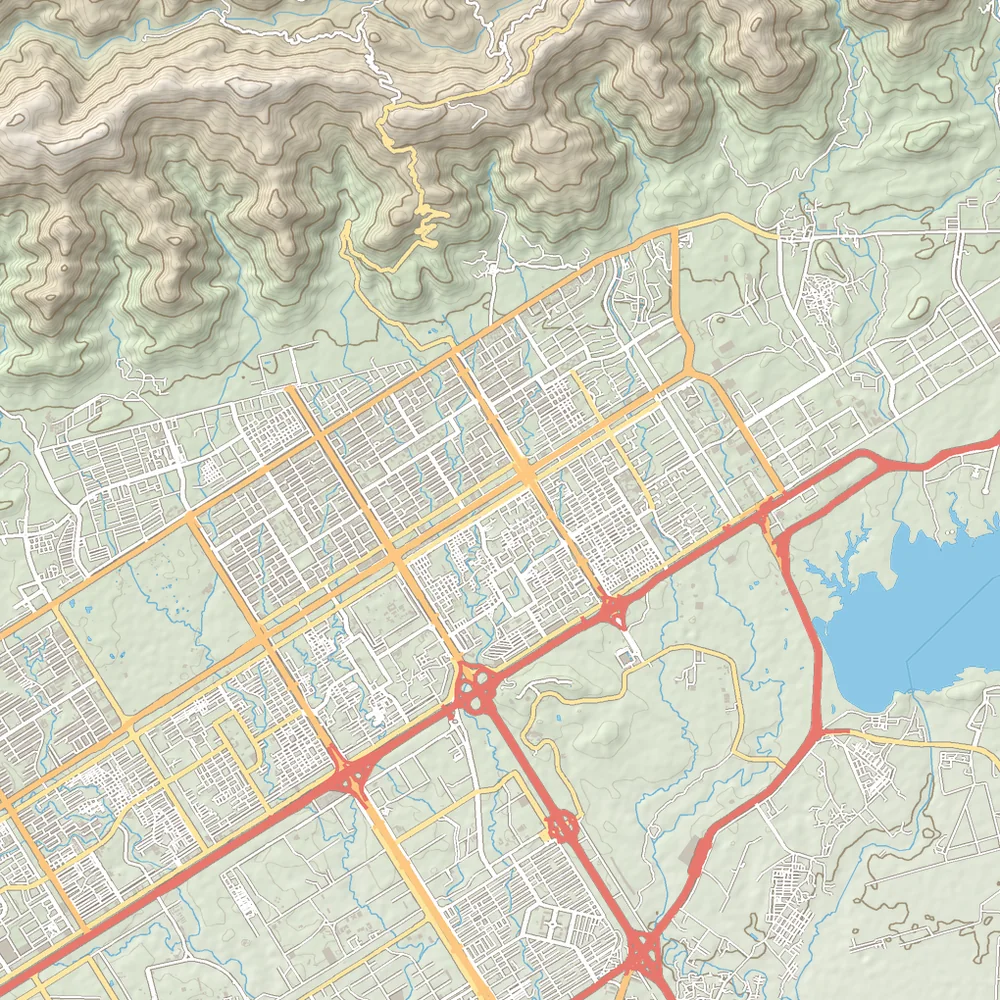
On the left, what a satellite sees. On the right, what a reader needs: a clear hierarchy of roads, buildings, water and terrain lines.
Drag the handle to compare. Good cartography removes noise and keeps the story, whether the map ends up in a report, on a wall or on a screen.
Imagery: Sentinel-2 cloudless 2023 by EOX IT Services, modified Copernicus Sentinel data (CC BY 4.0). Terrain: SRTM via AWS Terrain Tiles. Roads and buildings: © OpenStreetMap contributors (ODbL).
A good map replaces pages of description. These are the documents and audiences our maps are made for.
Map series that show flood, slope and seismic hazards around a site, as we produced for the Budalas hydropower facility.
District maps for planning documents and briefings, where officials need the key message on a single page.
Baseline, sensitivity and impact maps laid out to sit inside EIA and environmental management plan reports.
Story maps and clear graphics that explain floods or land change to residents, media and donors.
Good cartography is mostly decisions: what to show, what to leave out and how to make the main point obvious.
Who reads the map, where they read it and the one thing it must say.
Map brief and size
We gather and check the layers, sources and dates that each map depends on.
Checked source layers
Scale, symbols, colors, labels and layout drafted for the reader and the medium.
Draft map or template
You review the draft, and we check every label and value against the data.
Corrected final draft
Print files, images, web maps or story maps delivered with editable sources.
Print, web and source files
We choose the data source and the software to fit the job, then deliver in formats your team can open.
Send us the report, the audience and the data you have. We will reply with a proposed map list and a quote.
