We turn global climate model output into local projections for your planning horizon. You see how temperature, rainfall and extremes may change under different emissions scenarios, and how certain those results are.
Illustrative data, not a live feed or forecast.
Multi-model
ensembles, not a single model run
Scenario based
results across emissions pathways
Bias corrected
checked against historical observations
Decision ready
indicators, maps, data and reports
Climate projections support long-term decisions, so the method and its limits should be clear. We show what the models agree on and where they do not.
A documented record of current climate as the starting point for change.
Results from several climate models to show a range of possible futures.
Global results brought closer to the scale of your district, basin or asset.
Adjustments that reduce known differences between model and observed climate.
Model results translated into measures your sector uses.
A clear account of confidence, assumptions and limits for each result.
Five stages, from the planning question to results your technical and policy teams can use.
We define the area, time horizons, scenarios and decisions.
Study design
We gather and check historical observations and reanalysis data.
Verified baseline
We evaluate models for the region and choose an ensemble.
Model evaluation
We process results and validate them against observations.
Local projection datasets
We convert results into indicators, maps and guidance.
Reports, maps and data
The platforms and projects closest to this service.
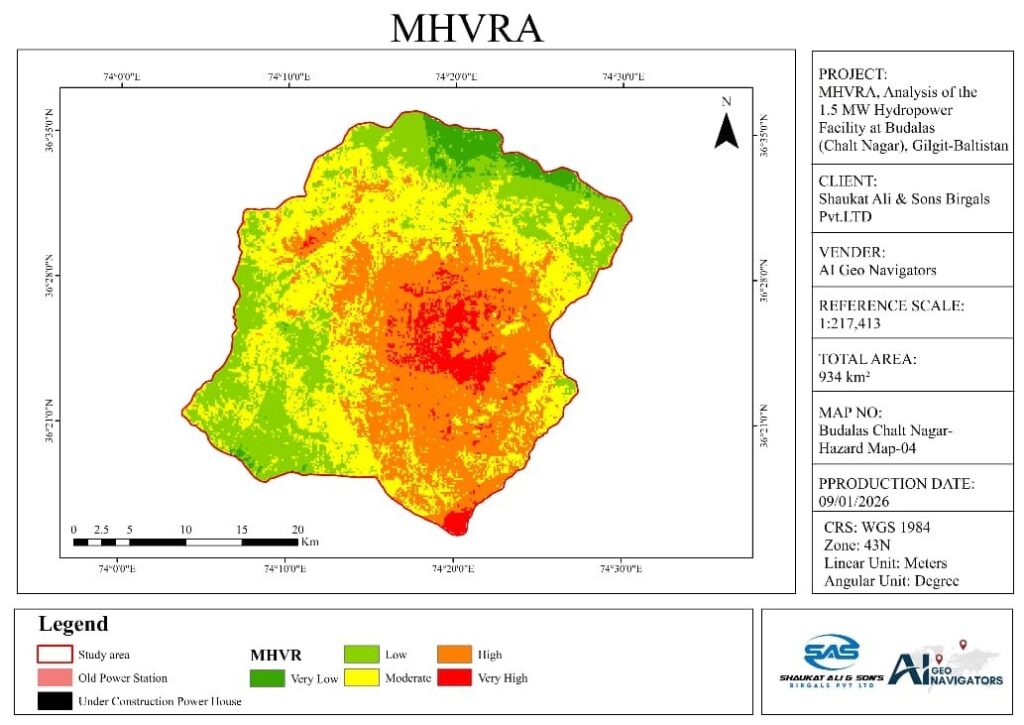
Budalas, Nagar, Gilgit-Baltistan
Flood, slope, seismic and climate hazards assessed for PWD Gilgit.
Client: PWD Gilgit
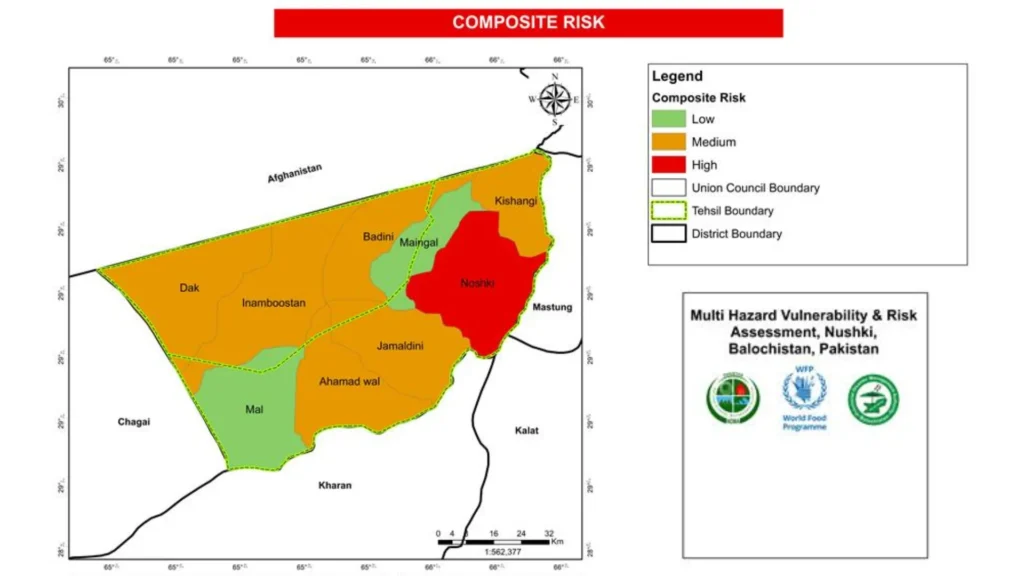
Nushki, Balochistan
Risk-prone zones, communities and assets mapped for the National Disaster Management Authority.
Client: NDMA
Platform · Live
Multi-model climate forecasting for operations in Saudi Arabia.
Live platform
We show the model range and explain the assumptions, so your team can see what the numbers can support.
Projections connect to maps, assets and hazards, so a trend can inform a site or district plan.
Our information security management is certified to ISO/IEC 27001.
Outputs can support adaptation plans, infrastructure design and climate disclosure work.
We select data and methods for the region, the variable and the decision.
Tell us the problem and the area. We will suggest the simplest way to solve it.
A forecast estimates weather for specific dates. A projection describes how climate statistics may change over decades under a stated scenario.
Shared Socioeconomic Pathways are standard scenarios used in climate research. They describe different possible futures for society and emissions, and they let us compare results on a common basis.
Models represent the climate system differently. An ensemble shows the range of plausible results and gives a stronger basis than a single model.
It depends on the source data, the variable and the observations available. For example, one published South Asia dataset provides daily data at 0.25 degree resolution. We state the effective resolution for every study.
Most studies compare a historical baseline with mid-century and late-century periods. We can align the periods with your plan or asset lifetime.
Yes. Projections can feed scenario analysis for frameworks such as IFRS S2. See scenario-based hazard impact assessment.
Climate Tech Services
What each hazard scenario means for people, assets, services and budgets.
Climate Tech Services
Flood, GLOF, landslide, heat and drought models that show where a hazard can reach.
Climate Tech Services
Site-level forecasts, alerts and weather data built for one location or network.
Tell us the area, the time horizon and the decision. We will reply with a clear plan and a quote.
