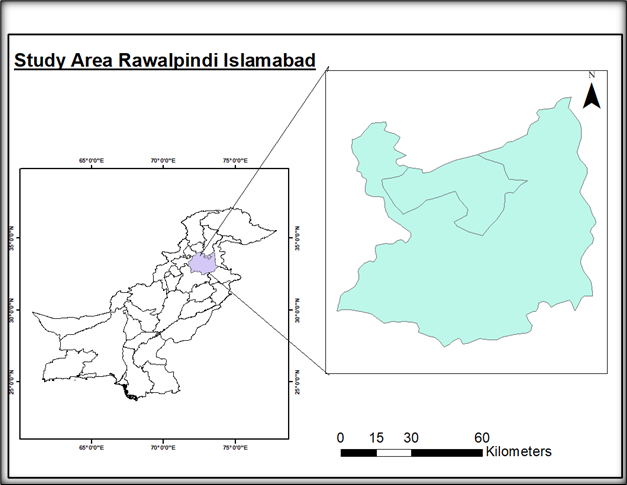
Islamabad and Rawalpindi have seen tremendous urbanization in the last ten years, with a noteworthy decrease in green cover and a notable increase in built-up areas. Particularly in densely populated places, this change has exacerbated the Urban Heat Island (UHI) effect, raising surface temperatures, causing thermal discomfort, and making people more susceptible to stress brought on by the environment.
From 2020 to 2024, this study assesses the spatial dynamics of population density, land surface temperature (LST), vegetation health using the Normalized Difference Vegetation Index (NDVI), urban expansion using the Normalized Difference Built-up Index (NDBI), and land use and land cover (LULC).
The work uses AHP to map thermal hotspots and UHI intensity zones using GIS and remote sensing in Google Earth Engine. It reveals that the greatest heat stress occurs in highly populated, low-vegetation areas, underscoring the necessity of green infrastructure and sustainable urban development.
Land Use Land Cover Analysis of Islamabad and Rawalpindi
To assess how land cover and land use have changed spatially over the past five years, particularly the growth of built-up regions and the decline of vegetative cover. This offers a basic understanding of the relationship between urban sprawl and temperature anomalies.
Vegetation Health Assessment using NDVI of Islamabad and Rawalpindi
To monitor the density and health of the vegetation by computing and analyzing the Normalized Difference Vegetation Index (NDVI) using data from remote sensing. This aids in locating regions where the loss of green cover could exacerbate UHI.
Built-up Area Evaluation using NDBI of Islamabad and Rawalpindi
To determine the built-up zones’ spatial expansion and compute the Normalized Difference Built-up Index (NDBI). Urban growth and its possible impact on changing thermal properties are quantified by this index.
Land Surface Temperature Mapping of Islamabad and Rawalpindi
To locate heat hotspots by extracting and visualizing Land Surface Temperature (LST) data throughout the twin cities. By tracking LST, it is possible to identify trends in surface warming that are directly related to modifications in land use.
Urban Heat Island Zoning of Islamabad and Rawalpindi
To combine land use indicators with LST to define the low, middle, and high Urban Heat Island (UHI) intensity zones. This goal uses multi-criteria geospatial analysis to identify the region’s most susceptible to the effects of urban heat.
Population Density Correlation of Islamabad and Rawalpindi
To evaluate how surface temperature and population density relate to one another spatially. The impacts of UHI are exacerbated by high human density, which is frequently associated with increased anthropogenic heat and impermeable surfaces.
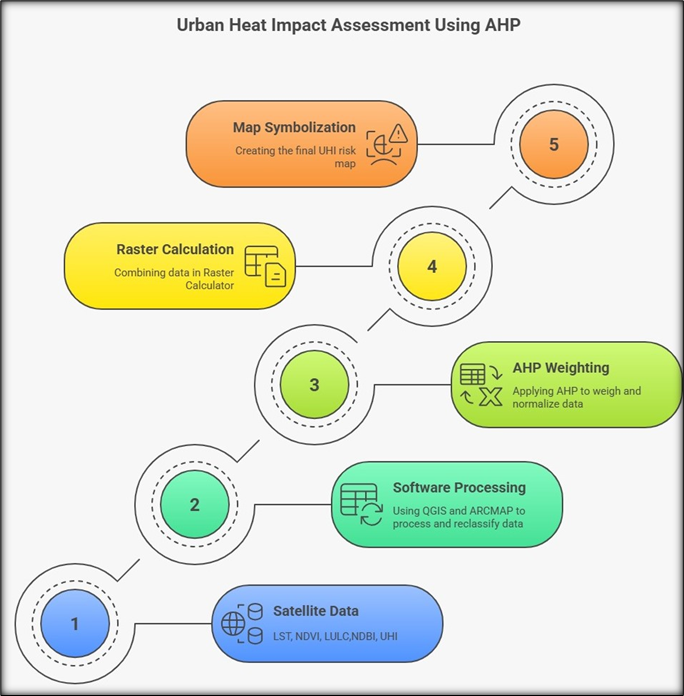
Workflow for Urban Heat Impact Assessment Using AHP Islamabad and Rawalpindi
Land Use Land Cover Analysis OF Rawalpindi and Islamabad 2020-2024
Rapid urbanization in Rawalpindi and Islamabad over the last five years has drastically changed the land’s cover and use. This research examines the spatial and temporal changes brought about by infrastructure expansion and population increase between 2020 and 2024 using Sentinel-2 imagery and supervised classification in Google Earth Engine (GEE).
The LULC classification reveals three dominant land cover categories
In Rawalpindi and Islamabad’s rural and peri-urban areas, crops continue to make up the majority of the land cover (35.5%). But these agricultural areas are gradually becoming smaller due to continuous urbanization.
Developing Regions (27.1%) As a result of fast urbanization, natural land covers have been replaced by roads, communities, and commercial sectors. The Urban Heat Island (UHI) effect is exacerbated and urban sprawl is fueled by this growth in populated regions.
Tree Cover (25.2%) Islamabad’s urban forests and green areas have decreased as a result of their conversion to institutional and residential areas, which has raised surface temperatures and decreased carbon sequestration. Urban growth and ecological health are clearly traded off, according to the LULC report.
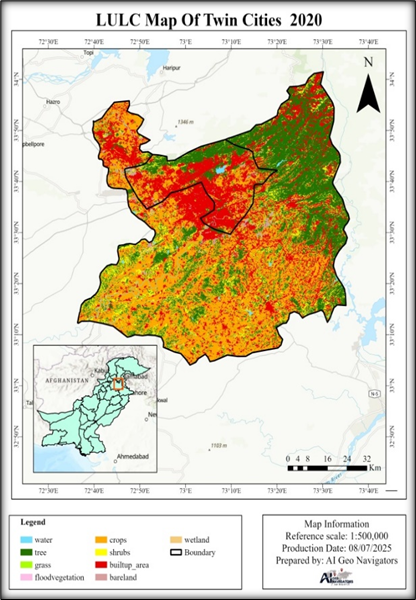
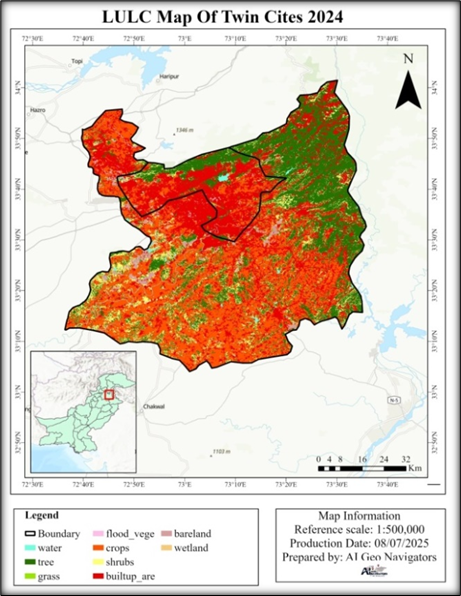
LULC maps of Islamabad and Rawalpindi comparing urban growth and vegetation changes between 2020–2021 and 2022–2023.
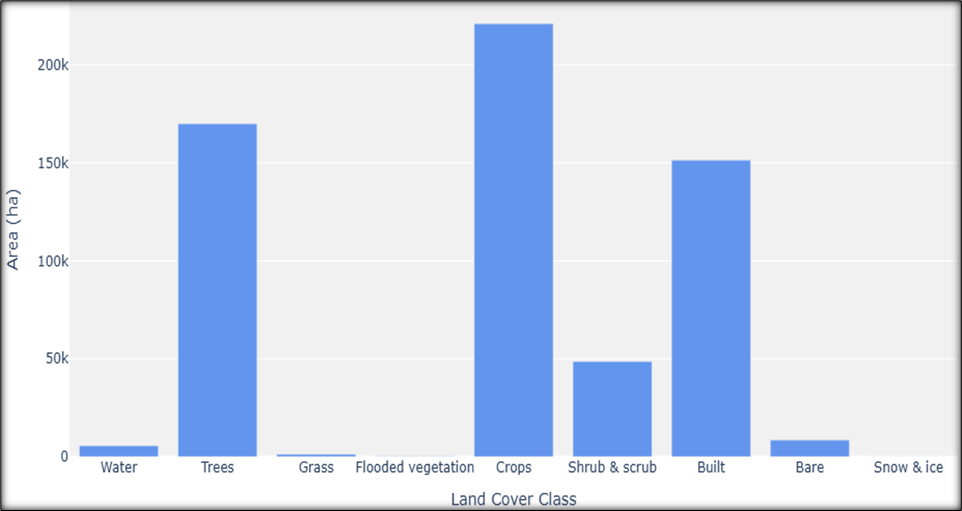
Bar chart showing dominant land covers class’s crops, trees, and built-up areas in Islamabad and Rawalpindi from 2020 to 2024.
Vegetation Analysis Using NDVI in Rawalpindi and Islamabad (2020–2024)
According to NDVI data from Landsat 8, the vegetation cover in Islamabad and Rawalpindi has been gradually decreasing between 2020 and 2024, with the most noticeable decline occurring in Rawalpindi’s densely urbanized regions. The average NDVI readings show erratic but declining patterns, especially in regions experiencing fast urbanization. By decreasing the natural cooling that plant provides and raising surface temperatures, this loss of green cover greatly exacerbates the Urban Heat Island (UHI) impact. Low-vegetation zones are clearly expanding on spatial NDVI maps, particularly in informal settlements and on the outskirts of cities.
The report emphasizes the urgent need for urban forestry programs, green corridor restoration, the protection of surviving vegetated zones, and the implementation of eco-sensitive land use laws in order to increase climate resilience and environmental quality in the twin cities.
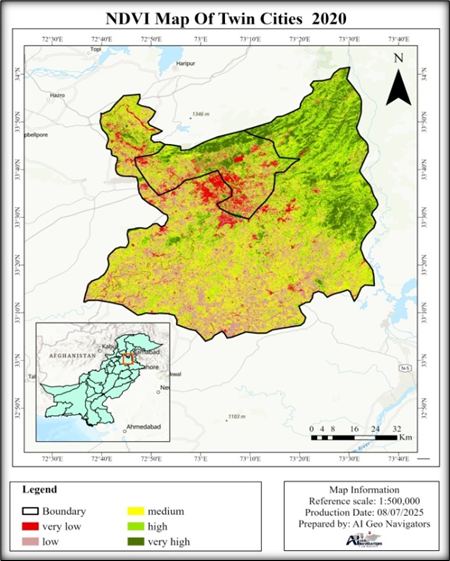
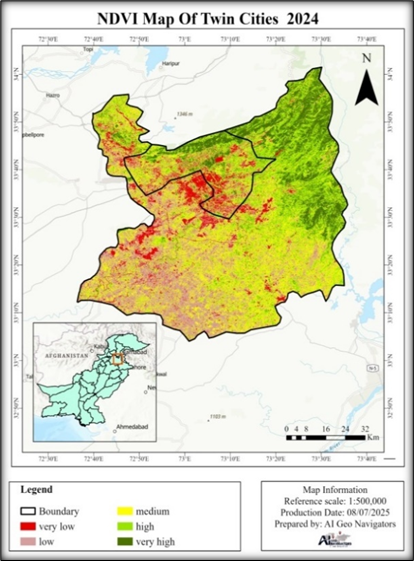
NDVI maps of Islamabad and Rawalpindi (2020–2024), illustrating vegetation decline and the expansion of low-NDVI zones as a result of rapid urbanization.
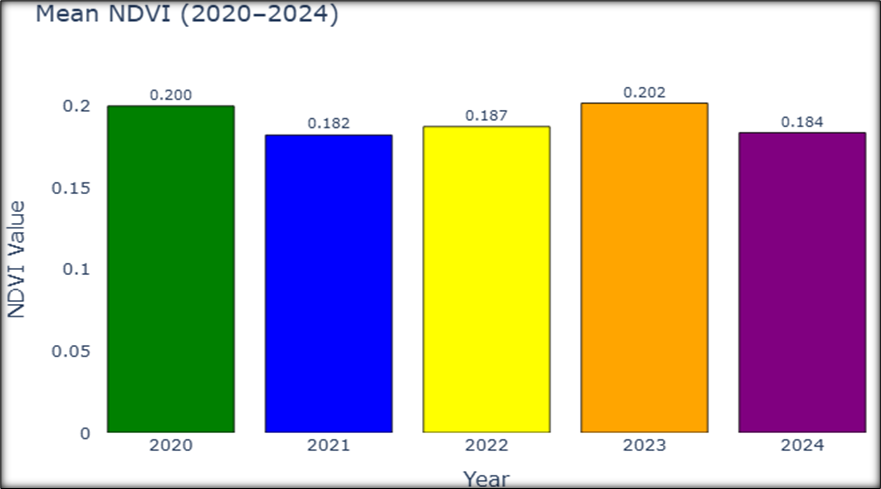
Mean NDVI values from 2020 to 2024 showing fluctuating vegetation health in Islamabad and Rawalpindi.
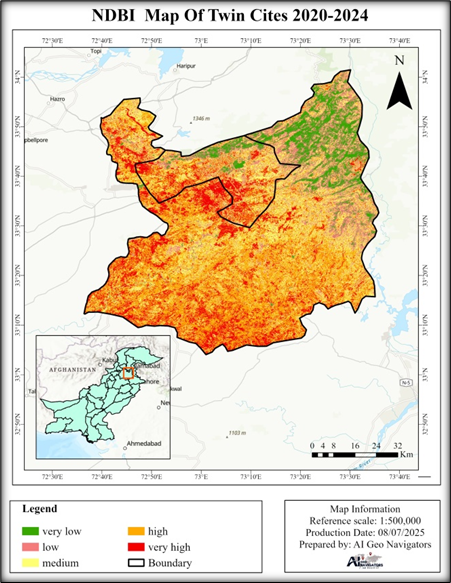
Built-up Area Analysis Using NDBI in Rawalpindi and Islamabad (2020–2024)
The Normalized Difference Built-up Index (NDBI) was computed using Landsat 8 satellite imagery in Google Earth Engine (GEE) for the years 2020 to 2024 in order to monitor urban growth and its effects on surface features. By comparing the reflectance of built surfaces against vegetation, NDBI successfully identifies regions that are built up, making it a crucial tool for tracking urban growth.
In both cities, the temporal NDBI patterns show a steady rising trajectory:
Rawalpindi: The built-up fabric has significantly developed, especially along important transportation lines and at peri-urban outskirts, as seen by the NDBI values rising from -0.061 in 2020 to -0.026 in 2024.
Islamabad: The NDBI increased from -0.055 in 2020 to -0.030 in 2024, indicating consistent growth in recently planned sectors (such as G-10 and I-12) as well as the extension of commercial and institutional zones.
Although Rawalpindi shows rapid, unstructured growth as a result of industrial spread and informal housing, Islamabad’s expansion is more planned and conforms to Capital Development Authority norms, according to spatial analysis. The conversion of green spaces into built-up zones is shown by a strong correlation between growing NDBI and changes in LULC and a decline in NDVI.
The Urban Heat Island (UHI) effect is significantly impacted by this increasing built-up intensity. Higher daytime temperatures and less cooling at night result from increased surface heat absorption and retention caused by the replacement of permeable soils and vegetation with impermeable surfaces.
As built-up areas grow and concrete and asphalt replace natural surfaces, the Urban Heat Island (UHI) effect gets exacerbated. Urban dwellers experience more heat stress and discomfort as a result of these materials’ ability to retain heat, which raises daytime temperatures and reduces cooling at night.
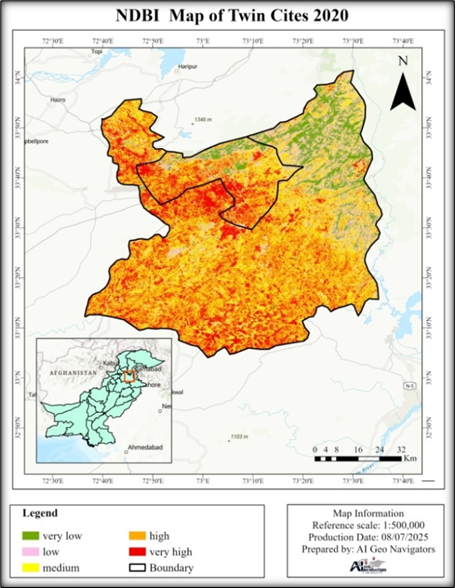
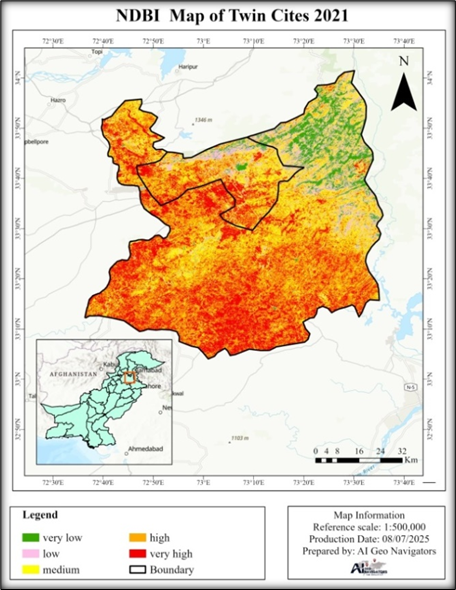
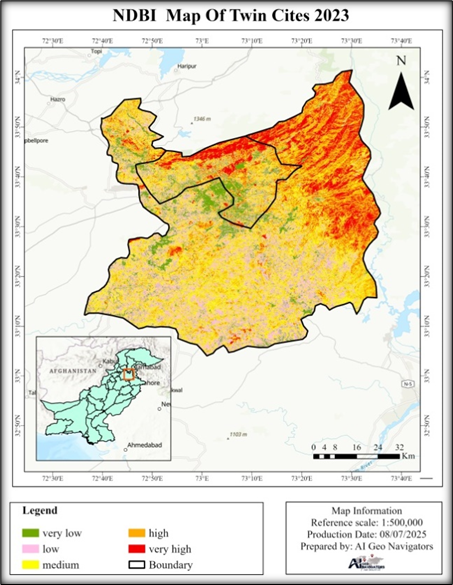
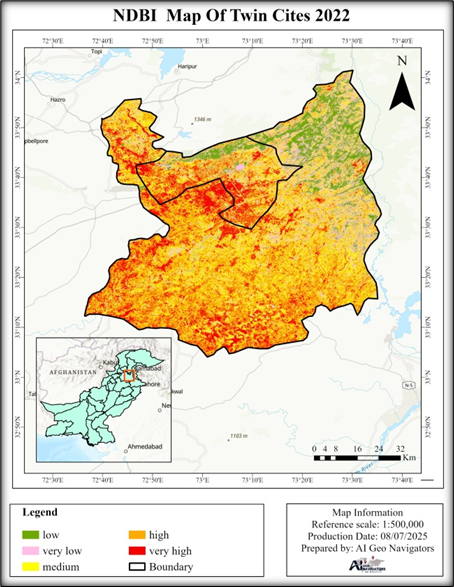
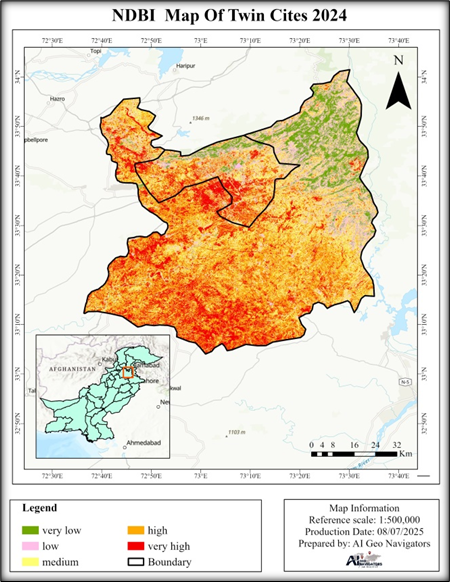
NDBI maps of Islamabad and Rawalpindi showing increased built-up intensity from 2020 to 2024 due to rapid urban growth.
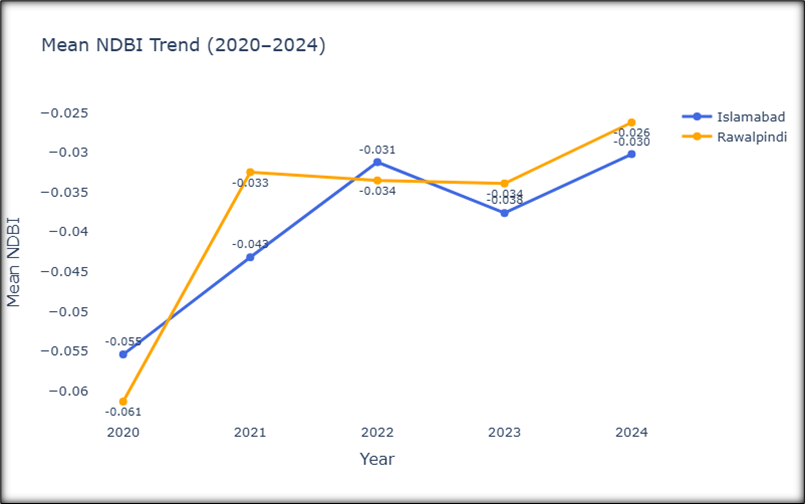
Rising NDBI trend (2020–2024) indicating urban growth in Islamabad and Rawalpindi.
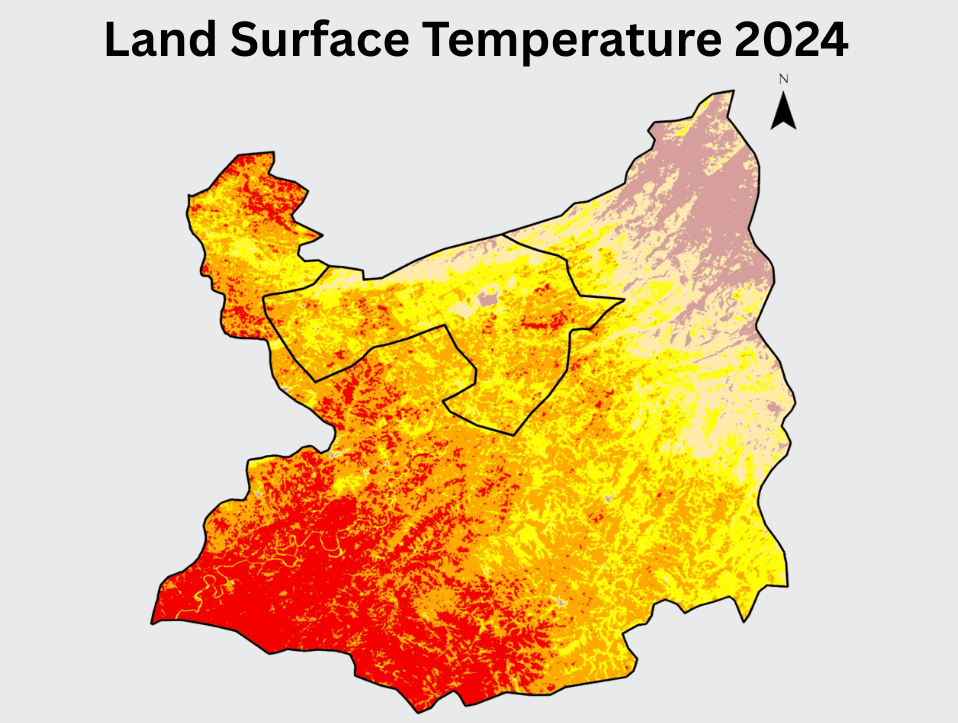
Surface Temperature Analysis Using LST in Rawalpindi and Islamabad (2020–2024)
Rapid urbanization, forest loss, and growing built-up areas are the main causes of the steady increase in surface temperatures observed in Islamabad and Rawalpindi, according to Sentinel-2 Land Surface Temperature (LST) data from 2020 to 2024. The areas with the greatest LST values are central Rawalpindi and the recently developed areas of Islamabad, like G-10 and I-12, where there is little greenery and a preponderance of impermeable surfaces. According to temporal study, LST levels peaked in 2022 and then significantly decreased in 2023, most likely as a result of seasonal climate variations.
In the process of increasing the Urban Heat Island (UHI) effect, moving from natural to impervious surfaces such as concrete and asphalt disturbs natural cooling processes. Rising NDBI and falling NDVI readings are directly correlated with this warming trend, highlighting how closely land cover changes and temperature patterns are related. Increased tree canopy coverage, reflecting and permeable materials, climate-responsive urban design, and strategic urban greening to restore the twin cities’ thermal balance are all strongly recommended by the study as ways to lessen these effects.
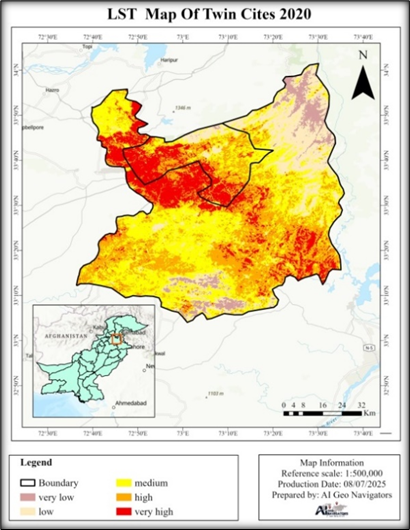
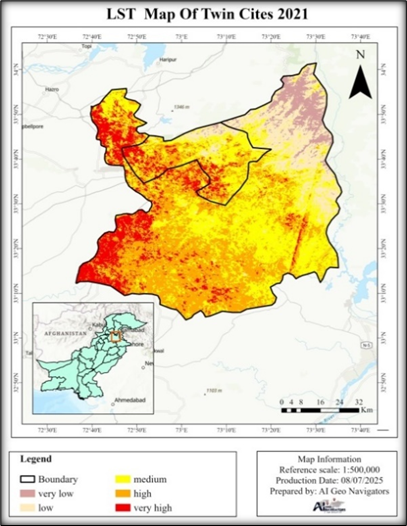
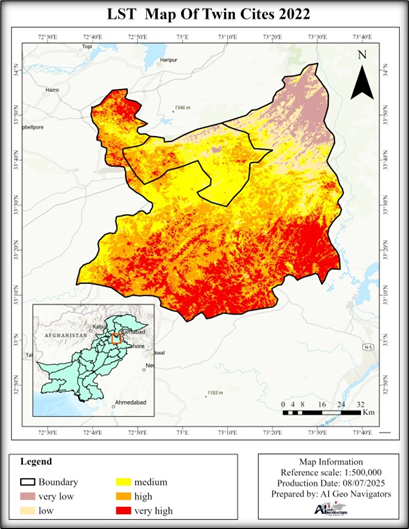
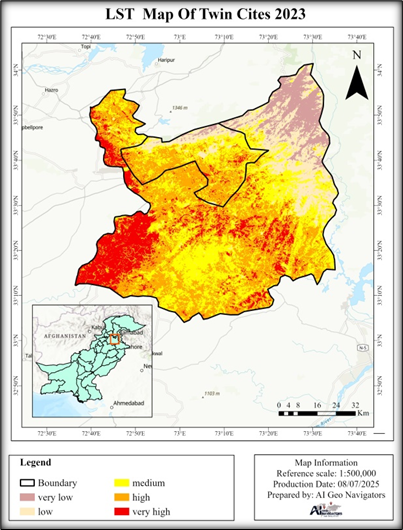
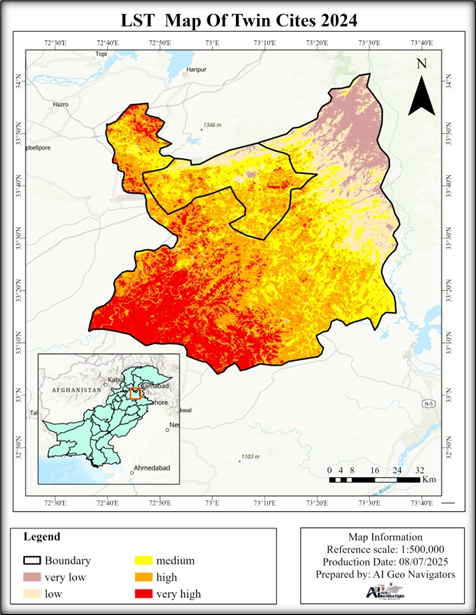
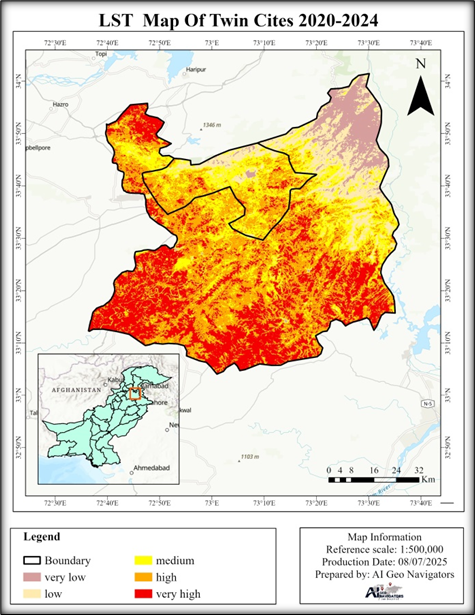
LST maps of Islamabad and Rawalpindi (2020–2024) showing increased surface temperature and expansion of high-heat zones.
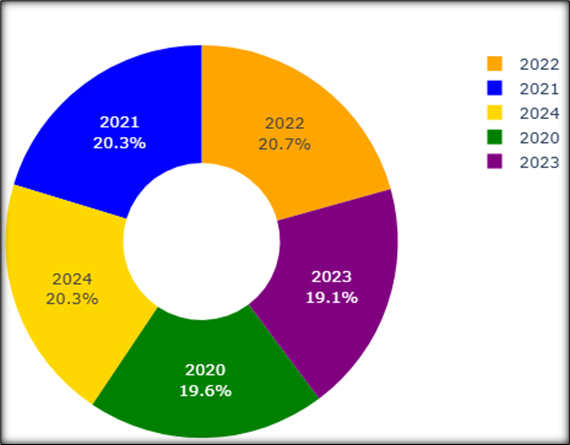
Year-wise LST share (2020–2024), highest in 2022 and lowest in 2023.
Urban Heat Island (UHI) Analysis in Rawalpindi and Islamabad (2020–2024)
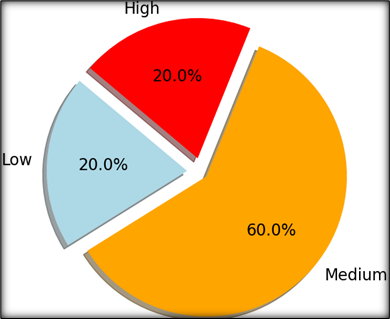
This study used Z-score normalization of Land Surface Temperature (LST) data in the Google Earth Engine (GEE) environment to classify Islamabad and Rawalpindi into Low, Medium, and High UHI zones. According to the analysis, 20% of the study area is in low UHI zones and 20% is in high UHI zones, with about 60% of the region falling within medium UHI intensity. The heavily populated and sparsely vegetated sections of Rawalpindi, particularly the industrial and informal settlement regions, are home to the majority of the city’s high UHI zones. High NDBI values and dropping NDVI trends are significantly correlated with these zones, suggesting that the loss of green cover and impermeable built surfaces are the main causes of UHI intensification. Low UHI zones, on the other hand, are usually located in Islamabad’s suburbs or peri-urban areas, where there is more vegetation and more planned urban growth.
The spatial relationship between land-use change, plant loss, and UHI emphasizes how urgent it is to incorporate climate-sensitive planning into future urban growth. In high-risk areas, priority should be given to reflective materials, vertical gardens, green roofing, and the maintenance and regeneration of urban green belts. To further reduce heat exposure and improve thermal comfort in both cities, urban planners and legislators use the zoning map as a tool for decision-making when identifying heat-vulnerable communities and focusing interventions like tree planting campaigns, sustainable zoning laws, and the encouragement of low-impact development (LID) practices.
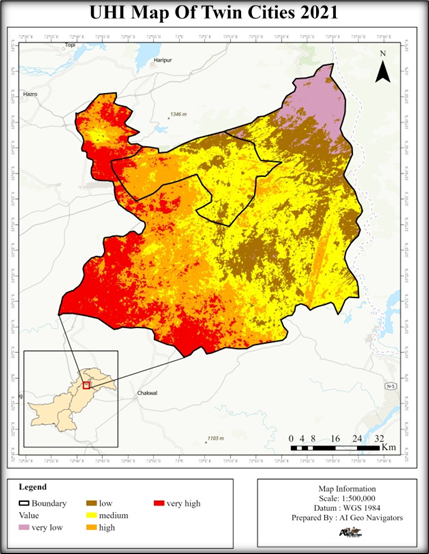
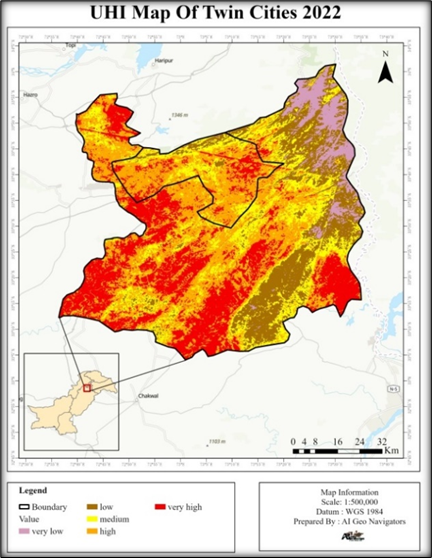
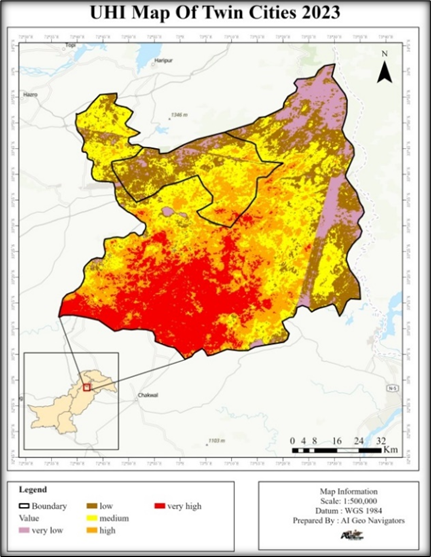
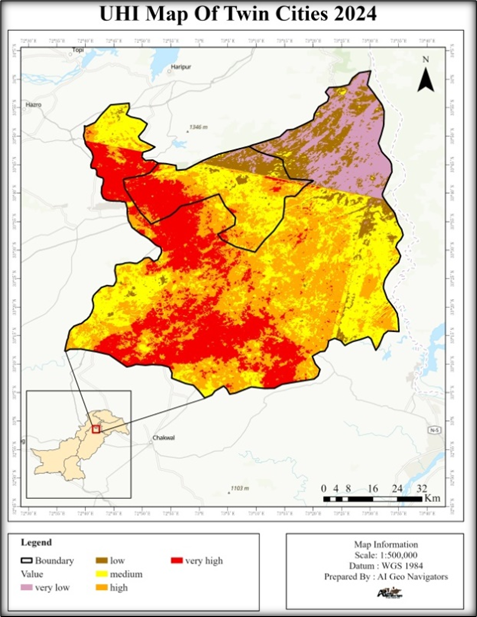
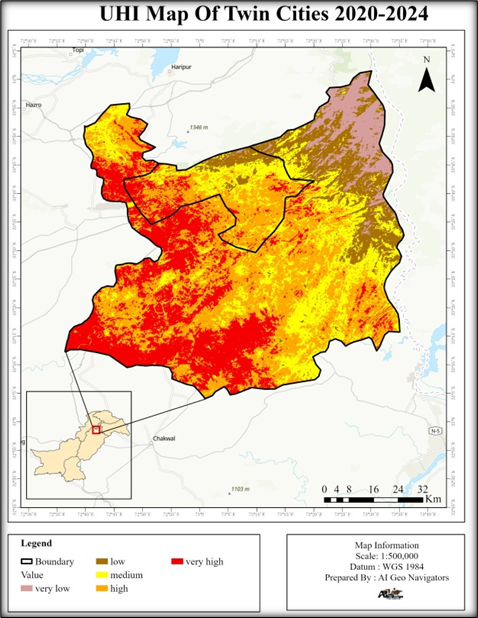
UHI maps of Islamabad and Rawalpindi for 2024 and 2020–2024, showing expansion of high and very high heat zones due to urbanization.
Urban Heat Island (UHI) intensity classification for Islamabad and Rawalpindi.
Population Distribution Analysis in Rawalpindi and Islamabad (2020-2024)
Only 2.1% of the territory is classified as extremely high density, whilst 63.1% is classified as extremely low density based on the population distribution. Despite their modest size, high-density zones are more exposed to heat because of the concentrated human activity and lack of greenery. Low-density areas, on the other hand, have greater cooling and more vegetation. In order to lessen urban heat exposure, the results emphasize the necessity of focused cooling techniques in areas with large population densities.
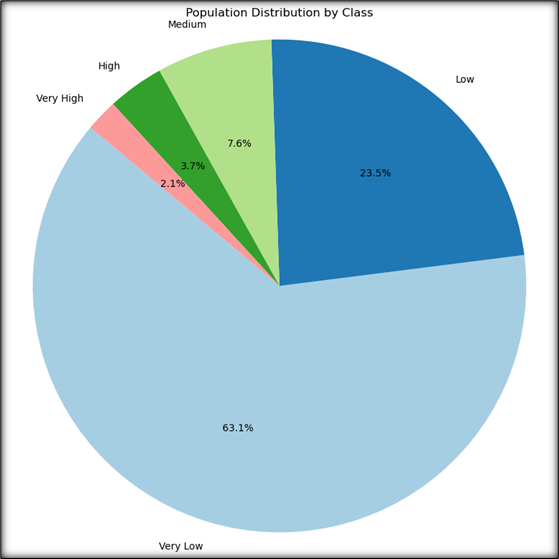
The population plot shows that most areas have low population density, with only a few zones highly populated.
Urban Heat Index Risk Map of Islamabad and Rawalpindi
Four important geographical indicators, NDBI, LST, NDVI, and LULC were integrated to create an extensive Urban Heat Index (UHI) Risk Map for Islamabad and Rawalpindi using the Analytic Hierarchy Process (AHP). The weighting of these factors was determined by how much of an impact they had on urban heat patterns.
The cities on the map are categorized into five heat risk levels, ranging from Very Low to Very High. The riskiest areas are found in places with lots of people and little greenery, especially in the heart of Rawalpindi and the quickly growing suburbs of Islamabad. Because of increased human activity and built-up intensity, these locations have high surface temperatures.
Authorities may prioritize climate adaptation initiatives and locate thermal hotspots with the use of this risk map, which is an essential spatial planning tool. It encourages focused actions including reestablishing green belts, increasing the amount of urban tree cover, and putting in place sustainable or reflective infrastructure in high-risk areas.
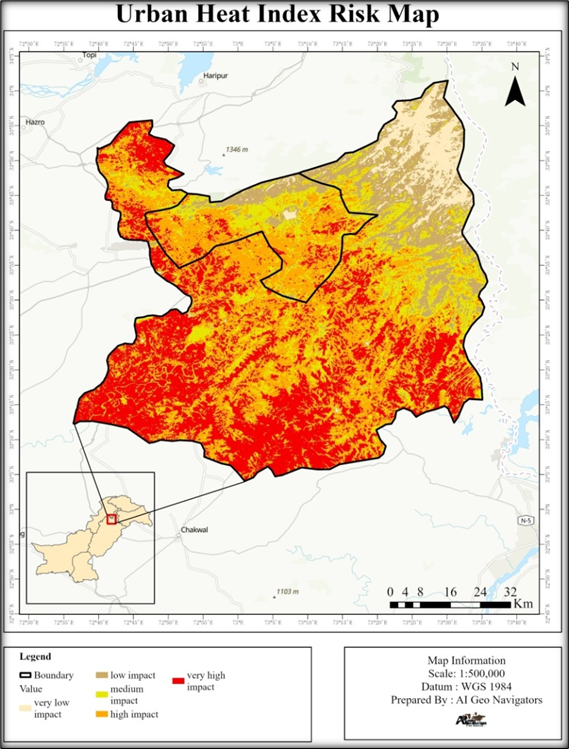
Urban Heat Index Risk Map of Islamabad and Rawalpindi.
Conclusion
This analysis shows how urbanization in Islamabad and Rawalpindi between 2020 and 2024 has greatly increased the impact of the Urban Heat Island (UHI) due to growing built-up areas and declining green cover. In order to identify high-risk thermal zones, the study uses geographical indicators NDVI, LULC, NDBI, LST, and population density integrated through the Analytic Hierarchy Process (AHP). In particular, the center and peri-urban regions of Rawalpindi and the recently constructed parts of Islamabad are characterized by dense building, little greenery, and elevated surface temperatures.
The results confirm that increasing urban growth is a direct cause of environmental deterioration and heat discomfort, since they demonstrate a high spatial association between growing NDBI values and lowering NDVI trends. Furthermore, the population density analysis shows that because of their increased anthropogenic heat outputs and lack of green infrastructure, even small high-density pockets are much more susceptible to heat.
The study highlights the urgent need for climate-resilient urban planning, which must incorporate the use of reflective and permeable building materials, the expansion of green infrastructure, the preservation of existing natural buffers, and sustainable zoning laws in order to lower these risks and improve urban livability. Restoring ecological balance requires tactics like the creation of urban woods, green corridors, vertical greenery systems, and climate-responsive architectural design. Informed policy decisions for sustainable and adaptable urban growth in the twin cities are supported by the UHI risk maps that are produced, which provide a useful planning tool for prioritizing action in heat-vulnerable zones.