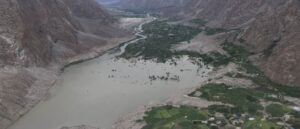
Soil erosion and landslides are among the most serious natural hazards affecting mountainous and hilly regions worldwide. These processes threaten human lives, damage infrastructure, and reduce land productivity. Traditional field-based monitoring is often limited by accessibility, time, and cost. To overcome these challenges, Geographic Information Systems (GIS) and Remote Sensing provide powerful tools to observe, analyze, and predict erosion and landslide risks with spatial and temporal accuracy.
Table of Contents
ToggleRole of Remote Sensing in Erosion and Landslides
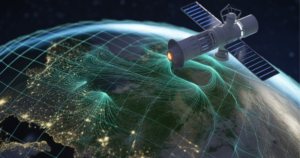
Remote Sensing allows continuous observation of land surfaces using satellite and aerial imagery. With multi-temporal images, researchers can detect changes in vegetation cover, soil moisture, and land use all of which are important indicators of erosion and landslide susceptibility. For example:
Optical satellite data (Landsat & Sentinel-2)
Optical satellite data such as Landsat and Sentinel-2 is extremely valuable in monitoring erosion and landslides because it captures detailed information about the Earth’s surface at regular time intervals. These sensors record data in multiple spectral bands, including visible, near-infrared, and shortwave infrared, which makes it possible to detect even subtle changes in land cover.
By analyzing vegetation indices like NDVI (Normalized Difference Vegetation Index), researchers can observe how plant cover is reduced due to soil erosion or slope instability. Similarly, time-series images allow us to track deforestation, bare soil exposure, and land-use changes that increase susceptibility to landslides.
Since the data is freely available and updated frequently, it provides a reliable way to identify high-risk zones, compare pre- and post-disaster conditions, and support early warning systems and land-management strategies.
Radar data (Sentinel-1, ALOS PALSAR)
Radar data, such as Sentinel-1 and ALOS PALSAR, provides a powerful advantage in monitoring landslides and erosion because it uses microwave signals instead of visible light. Unlike optical sensors, radar can penetrate through clouds and is not affected by weather conditions or daylight, which makes it reliable for continuous monitoring even during storms or in tropical regions with frequent cloud cover.
Radar imagery is especially valuable for detecting subtle ground and slope movements through techniques like InSAR (Interferometric Synthetic Aperture Radar), which measures surface deformation with centimeter-level accuracy.
This helps identify areas of gradual slope failure before a landslide occurs. Additionally, radar backscatter data highlights soil moisture variations and surface roughness, which are important indicators of erosion processes. Together, these capabilities allow Sentinel-1 and ALOS PALSAR to provide consistent, near-real-time insights into slope stability and land surface changes, supporting disaster preparedness and early warning systems.
LiDAR data
LiDAR (Light Detection and Ranging) data is one of the most effective tools for landslide and erosion studies because it produces high-resolution Digital Elevation Models (DEM) that reveal fine details of the terrain. Unlike satellite or aerial photos that only capture surface images, LiDAR uses laser pulses from aircraft or drones to measure the exact distance to the ground. This allows it to penetrate vegetation cover and generate highly accurate 3D models of the bare earth surface.
Such precision is essential for identifying slope angles, fault lines, drainage networks, and micro-topographic features that contribute to landslide susceptibility. For example, LiDAR DEM can detect small cracks, scarps, or subtle ground displacement that might be missed by conventional imagery. These detailed terrain datasets are widely used for landslide hazard mapping, erosion risk assessment, and designing slope stabilization measures, providing engineers and planners with reliable information for disaster prevention and land-use management.
GIS-Based Analysis to Monitor Erosion and Landslides
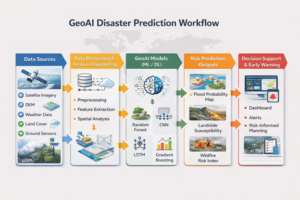
GIS enables integration of multiple spatial datasets to model erosion and landslide risk. By overlaying slope, aspect, soil type, rainfall, and land use, analysts can identify areas with high susceptibility. Common GIS techniques include.
Digital Elevation Model (DEM) analysis
Digital Elevation Model (DEM) analysis is a core GIS technique used to study terrain characteristics and their relationship to erosion and landslides. A DEM is essentially a 3D representation of the Earth surface created from satellite, LiDAR, or photogrammetry data. By analyzing a DEM, researchers can calculate slope steepness, which shows how rapidly elevation changes over distance steeper slopes are generally more prone to landslides.
The aspect (direction a slope faces) is also important because it influences sunlight exposure, soil moisture, and vegetation cover, all of which affect slope stability. Additionally, DEM are used to model drainage patterns, identifying how water flows across the landscape and where it may accumulate. These factors combined help in producing susceptibility maps that highlight areas at risk of erosion or landslides. DEM analysis therefore provides a scientific basis for hazard zoning, land-use planning, and early warning systems in vulnerable regions.
Erosion Models
Erosion models like the Revised Universal Soil Loss Equation (RUSLE) are widely applied within GIS to estimate soil loss and evaluate erosion risks. RUSLE is an empirical model that calculates average annual soil erosion by integrating multiple environmental factors, including rainfall erosivity (R), soil erodibility (K), slope length and steepness (LS), cover-management practices (C), and conservation support practices (P). When these factors are represented as spatial layers in GIS, they can be combined to generate erosion risk maps across large areas.
This approach allows researchers to identify erosion “hotspots,” compare soil loss under different land-use scenarios, and evaluate the effectiveness of soil conservation measures. For example, agricultural regions with steep slopes and poor vegetation cover often show high erosion rates in RUSLE-based maps. The model’s integration with GIS not only improves accuracy by using high-resolution data but also provides visual outputs that support policymakers, land managers, and planners in designing targeted interventions to reduce soil loss and maintain sustainable land productivity.
Landslide hazard zonation Mapping
Landslide hazard zonation is a crucial GIS-based technique used to classify areas into different levels of risk, such as low, medium, and high hazard zones. One of the most effective approaches for this is multi-criteria decision-making which combines several contributing factors to assess overall susceptibility. Methods like Analytical Hierarchy Process (AHP) and weighted overlay analysis are commonly applied.
In AHP, experts assign relative importance (weights) to different causative factors such as slope, aspect, geology, land use/land cover, rainfall, and proximity to faults or rivers. Pairwise comparisons are made to ensure consistency in judgment, and the results are converted into standardized weights. These weighted factors are then combined in GIS using a weighted overlay technique, producing a hazard map that highlights zones with varying landslide potential.
The final output is a classified map where areas are grouped into low, medium, and high-risk categories, providing decision-makers with a clear spatial understanding of where preventive measures, monitoring, or land-use restrictions should be prioritized. Such zonation maps are widely used in urban planning, infrastructure development, and disaster management to reduce vulnerability and improve resilience in landslide-prone regions.
Advantages of Using GIS and Remote Sensing to Monitor Erosion and Landslides
- Wide spatial coverage and cost-effectiveness compared to field surveys.
- Real-time or near real-time monitoring with high temporal frequency.
- Integration of diverse datasets (climate, geology, hydrology, land use).
- Support for decision-making in disaster risk reduction and land management.
GIS and Remote Sensing have transformed the way erosion and landslides are monitored and managed. By combining high-resolution satellite imagery with spatial analysis, authorities and researchers can identify vulnerable zones, design mitigation strategies, and enhance community resilience. As climate change accelerates rainfall variability and slope instability, these geospatial technologies will play an even greater role in disaster risk management.