Abstract
The monsoon in August 2025 brought severe flooding in the Sialkot and Narowal districts of Punjab, Pakistan, affecting about 1,045 km² of land. This research combines Sentinel-1 Synthetic Aperture Radar (SAR), and CHIRPS daily rainfall data to map flood extent and evaluate hydrological drivers. Sentinel-1 SAR data facilitated accurate flood delineation even in cloudy conditions, whereas Sentinel-2 imagery assisted in visual verification of flooded areas. CHIRPS data indicated that August rainfall was at its maximum at ~70 mm/day, promoting river overflow and surface runoff in the Chenab River basin. Flood mapping used radiometric calibration, speckle filtering, Outcome indicates that low-lying agricultural plains and riverbanks were worst-hit, underscoring the vital interplay of rainfall, topography, and drainage density in flood propagation. The study demonstrates that combination of multi-sensor satellite imagery and GIS provides an all-inclusive framework that can be used to assess floods within a short period of time thus facilitating hazard mapping, early warning and implementing measures on how to manage disasters. It produces repeatable techniques of flood surveillance in other monsoon-prone regions in Pakistan, which is not only sustainable risk management but also community resilience which is knowledgeable by science.
1. Introduction
This is because of the fact that the climate change has raised the frequency and intensity of floods in Pakistan by altering the rainfall pattern and this is the primary cause of melting glaciers in Pakistan north. The rise in global temperature has led to the super monsoon seasons and the total area of Pakistan, its districts, and areas that are under cultivation are being hit by such devastating floods in the recent past 2 decades (Ullah et al., 2023).
The most common and devastating disaster in Pakistan is flood, which is posing a harmful risk in human lives and infrastructure. Urban growth is also happening rapidly, while the recent floods in Pakistan in 2010, 2022, and recently 2025 have emphasized the maximum highlights for sophisticated methods to measure flood areas and formulate efficient risk reduction measures(Rana, n.d.). This structure has precise spatial data where timely monitoring is necessary to reduce disaster effect, enhance readiness planning. Remote sensing and GIS offer means for flood hazard analysis by merging various datasets, such as rain and surface water behavior.
In this context, Sentinel-1 imagery provides high-resolution images with multispectral bands. This provides surface analysis of water detection of 10 to 20 m spatial resolution, and maps can be created with flood extent in Pakistan’s Sialkot and Narowal. Application of Sentinel-1 SAAR optical has a better understanding of the recent flood patterns of the different lands and drainage basin areas of Sialkot and Narowal. The current conference paper features the evaluation of space and time in the Sialkot and Narowal districts of the August 2025 monsoon season (Zia et al., 2021). The maps have been used to identify the location of flood areas in Sialkot and Narowal using remote sensing techniques (NDWI), which plays a critical role in agricultural lands and loss of crop. Moreover, GIS integration has been so useful in the modern era, whereby it can track the earth information in the development of cost-effective and sufficient analysis to all regions. Such framework will not only help construct hazard maps but will also assist in early warning systems and in running disaster management efforts in the region Narowal and Sialkot in Pakistan through the use of sentinel data and GIS techniques, the outcome of which will contribute to sustainable disaster management and the improvement of the community around the site and the government in general in Pakistan (Latif and He, 2025).
2. Data and Methods
2.1 Study area
The investigation was carried out in Sialkot and Narowal districts, which lie in the north-eastern part of Punjab Province, Pakistan, between about 32°10′N to 32°50′N latitude and 74°10′E to 75°20′E longitude. These districts have India as their eastern border, while in the west they are bounded by Gujranwala and Gujrat districts. The area is about 5,000 square kilometers in extent and has flat to gently rolling topography with elevations between 200 and 300 meters above mean sea level(Latif & He, 2025). It falls within the Punjab active alluvial plains, which consist of fertile soils that allow intensive agriculture but which render it extremely vulnerable to flood inundation during monsoon rains. Hydrologically, the two districts come under the basin of the Chenab River, with number of tributaries and seasonal streams like the Aik, Palkhu, and Dek nullahs running across the terrain and influencing local flood patterns. With the intense rains, they tend to fill up in streams and overflow onto the nearby farm and residential land (Zia et al., 2021). Narowal and Sialkot climate is subtropical monsoon, hot during summer and mild during winter, and receive an annual rainfall of between 900 and 1,100 mm with most of it falling in July to September. Seasonal flooding is also an issue that is augmented by the heavy monsoon rain, the low topography, and the networked drainage systems in the region. The two districts are administratively divided into a number of tehsils and union councils with Sialkot city being a great business and industrial center and the land use is agricultural with scattered settlement and transportations.
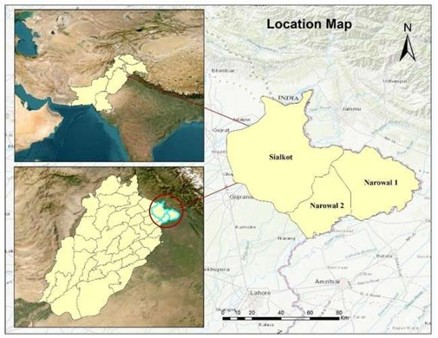
| Figure 1: Study Area |
3. Methods and Techniques
It has used remote sensing data and GIS analytical method to map and analyze the area covered by floods in Sialkot and Narowal districts of Punjab which have been grossly flooded in the August 2025 monsoon flood episode. Data of Sentinel-1 Synthetic Aperture Radar (SAR) was mostly utilized in delineation of floods since they cut through the clouds thus giving confidence that they are able to reliably detect the flooded regions even when the skies are cloudy. In addition, Sentinel-2 multispectral images were employed to help interpret visually and confirm the presence of floods influenced areas because of the high spatial resolution and sensitivity to surface water alterations (Miranda et al., 2023). It has also been based on the CHIRPS rainfall dataset daily (Climate Hazards Group InfraRed Precipitation with Station data) to understand the distribution of rainfall and the way it relates to the occurrence of floods. All the data were priori processed and harmonized within a GIS environment to allow similar spatial analysis. The data preprocessing and classification were done in Google Earth Engine (GEE) and ArcGIS 10.8. Sentinel-1 SAR data were processed following routine steps such as radiometric calibration, speckle filtering, terrain correction, and polarization selection (VV and VH). These routines improved the quality of radar backscatter and reduced geometric distortions. On GEE, atmospheric correction was performed on Sentinel-2 imagery to enhance optical clarity for efficient water detection. Temporal contrast among pre-flood (late August) and post-flood (early September) scenes allowed for the detection of inundation dynamics as well as spatial changes in surface water extent(Abuzwidah et al., 2024).The classified inundation maps were tested for accuracy visually using high-resolution Sentinel-2 imagery and Google Earth reference data. Additional cartographic refinement and processing were conducted in ArcGIS Pro,pattern of inundation focused along the Chenab River basin and its tributaries, especially in low-lying agricultural areas(Ma et al., 2011). This combined remote sensing and GIS-based methodology gives a solid and reproducible framework for flood hazard evaluation, facilitating reliable spatial quantification and informing disaster management and mitigation planning in flood-risk zones.
3.1 Results
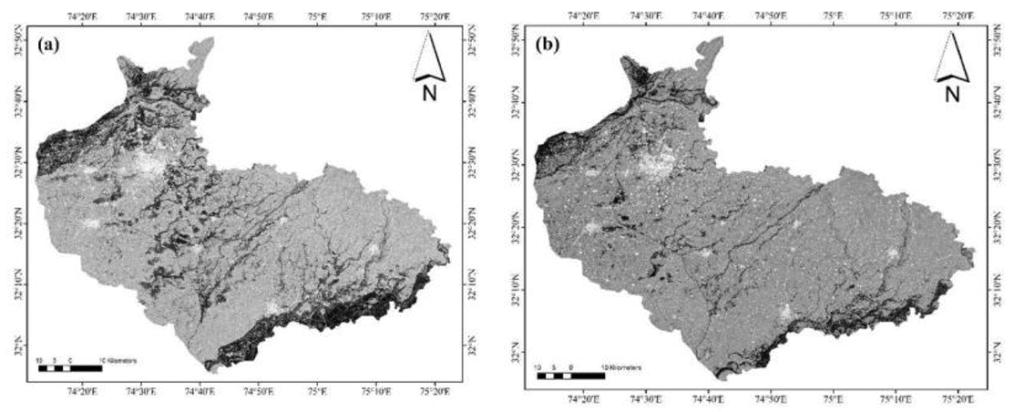
Figure 2. (a) Flood extent derived from Sentinel-1 SAR on 27 August 2025. (b) False-color Sentinel-1 image highlighting flooded areas on 4 September 2025. 3.1.1 Flood pattrens
The flood pattern study was conducted with the use of false-color composite imagery from the Sentinel-1 SAR VH and HH polarization bands, which were merged to support better visual interpretation of flooded areas. The false-color figure 2a and 2b simply reflects the flooded areas, with the flooded areas appearing in dark blue tones standing out against non-flooded land. This visualization efficiently conveys the distribution of surface water that built up in August 2025 during the flood event. Figure 3a and 3b signifies the processed flood extent map, focusing on zones of peak inundation. The findings indicate that most of the flooded areas are concreted in lines along the Chenab River and its surrounding tributaries, especially in lowlands of agricultural plains and riverbanks. The extent of flooding mapped in these figures constitutes compelling visual evidence of the spatial extent and intensity of the event, agreeing with hydrologically observed events and rainfall data extracted from CHIRPS. This coupling of radar-based false-color composites with classifications further improves the fidelity of flood mapping and facilitates improved insight into flood dynamics in Sialkot and Narowal districts.
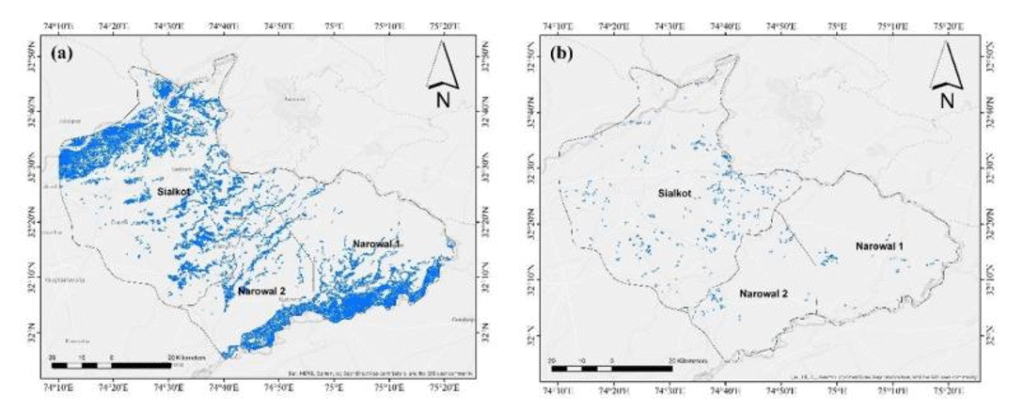
| Figure 3. (a) Flood extent derived from Sentinel-1 SAR on 27 August 2025. (b) Flood extent on 4 September 2025 using false-color Sentinel-1 imagery. |
3.1.2 Rainfall Analysis
The pattern of rainfall distribution was examined with the CHIRPS daily rainfall dataset to grasp the temporal pattern of rainfall within the research area and how it relates to the August 2025 flood events. Figure 4a shows the accumulated total daily rainfall for eight months, while Figure 4b depicts the trend in monthly intensity of rainfall. The study indicates that in the month of August, the average precipitation per day amounted to about 70 mm, showing a considerable hike in rainfall compared to other months, which usually recorded less than 50 mm. This sudden spike in rainfall intensity in August coincided with the 2025 peak monsoon season, which directly led to the extensive flooding witnessed in Sialkot and Narowal districts.
In Pakistan, the northern and northeastern parts usually experience more rainfall because of the South Asian monsoon system, which delivers wet air masses from the Arabian Sea and Bay of Bengal. The pattern of rainfall usually lasts from July to September with August as the wettest month of the year. Heavy and persistent monsoon rains over this time not only water the lowland floodplains but also hasten glacial melting in the northern mountain ranges, especially in Karakoram and Himalaya. The synergistic impact of high rainfall and glacial runoff boosts the discharge in large river systems like the Chenab, Jhelum, and Indus, which causes disastrous flood catastrophes downstream.
The outcome of Figures 4a and 4b therefore captures a strong connection between extreme rainfall events and flood severity. The temporal rainfall distribution identifies August as the pivotal month leading hydrological risk in Punjab. Elucidating this seasonality is very important for flood forecasting, early warning, and management of water resources, especially for vulnerable settlement and agricultural areas of the Sialkot and Narowal floodplains.
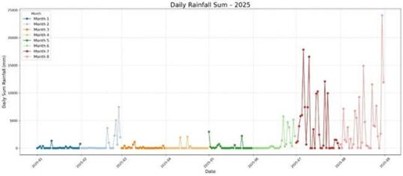
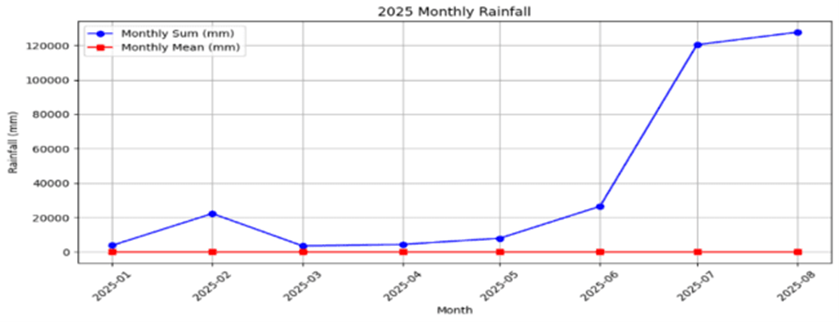
| Figure 4. (a) Daily rainfall distribution. (b) Monthly accumulated rainfall. |
4. Discussion and Conclusion
The combined analysis of Sentinel-1 SAR, multispectral imagery, and CHIRPS rainfall data gave a detailed insight into the dynamics of the floods witnessed in Sialkot and Narowal during the August 2025 monsoon. The results firmly point toward heavy monsoon precipitation, at an average rate of about 70 mm daily in August, as the predominant driver for the widespread flooding noticed in the two districts. The time series rainfall pattern based on CHIRPS data validated an abrupt jump in precipitation intensity in August from earlier months and this resulted in quick surface runoff, overflow of the rivers, and extensive flooding, mainly from the Chenab River and its tributaries. The Sentinel-1 VH and HH polarization bands-based false-color composite imagery accurately marked flooded areas, where blue-colored areas of water-covered land stood clearly out from non-flooded areas(Haq et al., 2012). This resulted in correct visual confirmation of floodwater aggregation within the low-lying plains, riverbanks, and cropland. The combination of the remote sensing data with GIS-based processing improved the accuracy of flood mapping, while the NDWI classification was able to differentiate water bodies from non-water surfaces. The combined application of Google Earth Engine and ArcGIS Pro facilitated effective pre-processing, classification, and visualization of flood extent, ensuring proper interpretation of spatial patterns. The findings not only identify the direct correlation between severe monsoon precipitation and the severity of floods but also underpin the role of topography, proximity to the river, and drainage density in the regulation of flood extension over the study area. The findings illustrate that the integration of multi-sensor satellite data presents a sustainable model for flood hazard mapping and risk analysis for monsoon-risk areas(Abuzwidah et al., 2024; Rana, n.d.). In conclusion, this research highlights the importance of combining remote sensing and GIS methods in tracking flood occurrences, facilitating disaster preparedness, and informing effective management practices. The applied methodology can act as a model for replicability in other flood-risk districts of Pakistan, fostering the establishment of early warning systems, better spatial planning, and climate-resilient flood risk reduction within the backdrop of a changing climate(Nadeem et al., 2022).