In a world where climate extremes are becoming a bigger concern, the combination of GIS and climate resilience offers not only data but also a lifeline. This enables communities to plan, prepare, and adapt for a future that is safer and more sustainable. Over the past century, the average temperature of our globe has increased by 1.4°F.
Changes in rainfall, floods, droughts, or heavy rains, as well as more frequent and severe heat waves, have all been brought on by this increase in global temperatures. Although greenhouse gases are necessary for life, human activities are changing the amount of these gases in the atmosphere, leading to global warming. To better understand this complex situation, researchers, approaach developers, designers, engineers, and many others have used Geographic Information System (GIS) innovation.
Numerous GIS applications are being used for mapping floodplains, preparing for and responding to warnings, calculating damage and restoring ecosystems, and forecasting the time-based loss of glacier covers and the ensuing rise in sea level. By measuring the processes and spatiotemporal states of the atmosphere, land, and oceans, satellite remote sensing combined with GIS has significantly advanced our understanding of the climate system and its variations.
Outlining the several GIS applications that can be used for different purposes will be the main focus of the paper. Decision-makers may easily visualize the effects of climate change and work toward creating a resilient system by using GIS to evaluate vast data at the global and regional levels.
Table of Contents
ToggleThe Role of GIS in Climate Resilience Planning
The ability of ecosystems, societies, and groups to resist and adjust to pressures and shocks brought on by climate change is known as climate resilience. Resilience development calls for significantly more than just traditional planning; it also calls for historical data, geographical intelligence, and future-oriented scenarios.
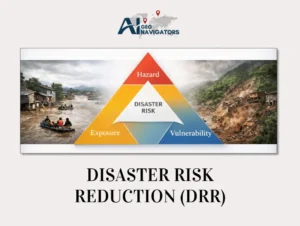
For data-driven decision-making, GIS provides strong resources, so it is very important for improving climate resilience. Mapping hazards and vulnerabilities is one of its main responsibilities; this enables authorities to pinpoint areas most susceptible to climate-related events including heat waves, droughts, floods, and sea level rise.
GIS also simplifies ongoing environmental monitoring by using remote sensing and satellite imagery to monitor fluctuations in land use, water resources, vegetation cover, and atmospheric conditions throughout time. It also facilitates thorough projections of future climate effects, which lets designers simulate scenarios and evaluate the possible outcomes of several adaptation measures.
By offering real-time situational awareness, locating safe zones, and mapping evacuation routes, GIS is vital during disasters to help emergency response. Among the data layers GIS combines to assist build resilient cities and communities and to direct infrastructure and urban planning are hazard zones, population density, and crucial amenities.
Finally, GIS offers governments and companies a shared spatial basis for organizing climate resilience initiatives across several sectors, including health, agriculture, water management, and disaster risk mitigation.
Flood Risk Management Using GIS and Climate Resilience Tools
The areas affected by monsoons, tropical storms, and glacier melt, flooding is among the most regular and damaging climatic catastrophes. Effective management is absolutely vital given the increasing frequency and severity of floods brought on by climate change. Simulation of flood scenarios, analysis of hydrological trends, flood hazard identification, and disaster readiness improvement are made possible by GIS and climate resiliency technology.
A topographical map of the area vulnerable to flooding can be created, expanded, and printed using GIS effectively and exactly. Though not a real depiction of actual flood behavior, digitizing floods in maps utilizing GIS has shown to be a helpful planning phase companion when combined with other available flood information.
With the aid of GIS tools, flood extents at particular periods are superimposed on a three-dimensional Digital Elevation Model (DEM) to produce an animation of expected flood immersion. Expecting a map with a rich arrangement of fundamental information onto a screen and being able to control various parts of the map during flood planning has very much improved communication between crisis managers and has encouraged a more definite awareness of the problems to be addressed. GIS comprises several programs including ARCGIS, QUANTUMGIS, MAP INFO, etc. The model is first processed in these; then river and reservoir are digitized.
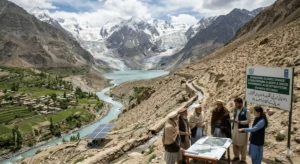
GIS-powered early warning systems using hydrologic models together with real-time weather data are in use in numerous nations including Bangladesh, India, and Pakistan. These systems help you to plan evacuations, distribute resources, and handle crises more effectively. The devastating floods that hit Pakistan in 2022 remind us of GIS’s significance. More than 33 million people were impacted by record-breaking rain, which also forced millions to move. GIS systems were essential for tracking flood levels, guiding aid efforts, and guiding rehabilitation operations.
Urban Heat Islands and GIS-Based Heatwave Monitoring
Cities are increasingly sensitive to heat waves as world temperatures rise because of the Urban Heat Island (UHI) effect. Temperatures in cities are sometimes many degrees warmer than those in adjacent rural regions since heavily populated areas, marked by concrete, asphalt, and little vegetation, absorb and keep more heat.
GIS and climate resilience solutions analyzing Land Surface Temperature (LST) data acquired by satellite systems like Landsat and MODIS help to find these areas vulnerable to heat. Planners can prioritize adaptive initiatives and pinpoint high-risk communities by integrating socioeconomic data with thermal images.
Using GIS insights, municipal planners can create targeted urban cooling policies. Installing green roofs, increasing permeable surfaces to lower heat retention, rearranging streetscapes with canopies and shaded sidewalks, and establishing cooling centers for vulnerable communities during heat waves are among these methods. Several cities—including Melbourne, Singapore, and Los Angeles—have already put GIS-driven heat abatement approaches combining urban design and climate projections to provide more climate-resilient urban surroundings into action.
Sea Level Rise and Coastal Climate Resilience with GIS
Rising sea levels threaten millions of inhabitants of island countries, thickly inhabited delta regions, and low-lying coastal villages with flooding, relocation, and infrastructural damage. For thorough coastal risk evaluations, GIS combines LiDAR elevation data, coastline erosion monitoring, storm surge models, and population exposure analysis. Decisionmakers can use these GIS-driven models to find the most at-risk groups and places and to imagine the potential scope of coastal flooding.
These results suggest that authorities may give adaptation initiatives like erecting coastal protection infrastructure such as levies and sea walls, arranging controlled retreats and resettlement for populations at risk, and rehabilitating wetlands to function as natural barriers against storm surges and erosion top priority.
Among the best examples on Earth is the Netherlands, where GIS-based sea level rise modeling backs the Delta Works project, which combines state-of-the-art engineering, environmental restoration, and long-term urban planning to protect millions of people from the persistent danger presented by rising sea levels.
GIS for Building Climate-Resilient Cities
In order to create comprehensive policies that address multiple climate threats simultaneously and increase urban resilience, GIS has become a crucial technological tool. The increasing use of GIS and climate resilience tools in smart city construction enables real-time infrastructure monitoring, dynamic traffic, and evacuation routing, integrated water resource management, and climate-predictive energy grid optimization.
City planners can utilize GIS platforms to overlay multiple data layers, such as infrastructure networks, population density, the locations of critical facilities, and projected climate threats, to prioritize projects that improve resilience and make well-informed investment decisions. An outstanding illustration is Singapore’s “Smart Nation” initiative, which employs IoT sensors, real-time data analytics, and GIS technologies to enhance urban sustainability and livability for its residents while proactively managing climate-related risks.
GIS, Climate Resilience and Policy Integration
GIS and climate resilience provide a robust data-driven basis for disaster preparedness plans, climate financing allocation, and National Adaptation Plans (NAPs) to be supported by foreign funders and policymakers. GIS-generated outputs are being used more and more by international development organizations like the World Bank, UNDP, UNEP, and WWF to evaluate climate risks, pinpoint priority areas for investment, and track the success of adaptation initiatives.
For instance, in a number of African nations, the UNDP-funded Climate Information and Early Warning Systems Project uses GIS-based hazard maps to enhance community readiness, disseminate early warnings, and direct agricultural recommendations. Furthermore, GIS-based climate data makes it easier to create grant applications and donor proposals, guarantee transparent reporting for climate funds, ease government agency coordination, and allow evidence-based resource allocation, which guarantees that adaptation efforts are focused where they are most needed.
The Future: GIS, Climate Resilience and AI Integration
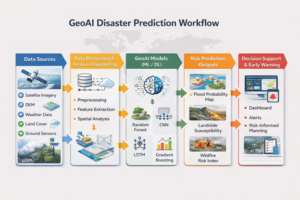
The combination of GIS with big data, cloud computing, and artificial intelligence (AI) is creating exciting new opportunities for climate resilience as climatic hazards become more complicated. New developments include automatic satellite image classification for quick damage assessments, machine learning techniques for predictive flood and drought modeling, and real-time monitoring platforms like Google Earth Engine that immediately handle enormous volumes of geospatial data.
Furthermore, more and more useful field data is being added to geographic databases by citizen scientific applications like Global Forest Watch and iNaturalist. Large-scale historical and current climate datasets can be analyzed by AI-powered GIS platforms, which can then identify minute patterns and produce extremely precise risk predictions. Instead of depending just on reactive solutions after disasters occur, this enables proactive resilience planning, which helps decision-makers get ready for possible risks before they develop into major crises.
Limitations and Capacity Gaps in GIS and Climate Resilience
Even though GIS has enormous potential to improve climate resilience, a number of obstacles still prevent its widespread use, especially in developing nations. Many areas struggle with a lack of technical expertise and skilled workers who can use GIS tools and evaluate intricate spatial data. Furthermore, low-income countries frequently cannot afford GIS technology because of the high cost of specialized hardware, software licenses, and access to high-resolution data.
Particularly in sensitive areas where trustworthy climate and environmental data is limited or nonexistent, data gaps and discrepancies continue to be a major obstacle. Better cross-border data exchange and the creation of open-source platforms that might increase the accessibility of crucial geospatial data are also urgently needed.
Addressing these limitations will require continuous investment in capacity building and GIS education, the development of affordable cloud-based GIS services that are easy for resource-constrained countries to use, the establishment of public-private partnerships to facilitate data sharing, and increased international cooperation to establish unified climate data standards.
Conclusion
As climate change accelerates, the stakes for building climate resilience are rising every day. Geographic Information Systems (GIS) not only offer powerful analytical tools but also offer a new, data-driven, spatial, and locally relevant perspective on climate adaptation.
From heatwave forecasting to flood mapping, from sea level rise assessments to resilient urban planning, GIS and climate resilience are radically changing how the world gets ready for an uncertain future. Governments, funders, scholars, and communities must embrace GIS technology as an essential element of effective climate adaptation strategies rather than as supplemental resources.
The time has come to act, and GIS is showing the way.