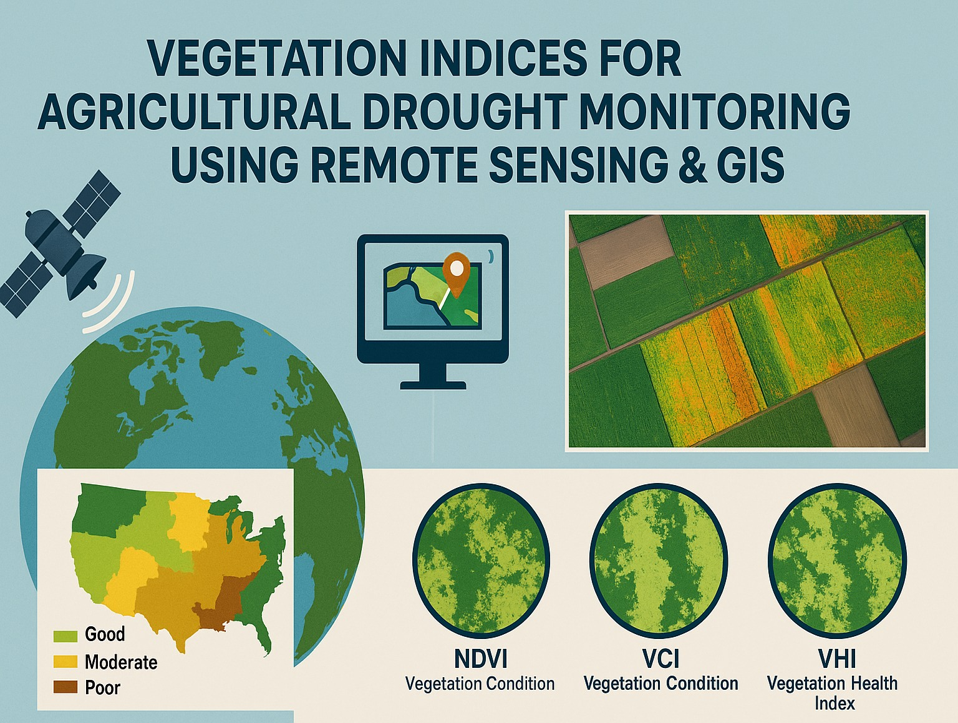
Agricultural drought is a major environmental and socio-economic challenge that threatens global food security. Traditional drought monitoring methods relying on ground-based observations are often limited in coverage, costly, and time-consuming. Remote sensing combined with Geographic Information Systems (GIS) provides a powerful and cost-effective approach to monitor agricultural drought across different spatial and temporal scales.
Vegetation indices derived from satellite data such as the Normalized Difference Vegetation Index (NDVI), Vegetation Condition Index (VCI), and Vegetation Health Index (VHI) are widely applied to assess vegetation health and detect drought stress.
GIS enhances these analyses by integrating multi-source datasets, performing spatial modeling, and producing drought risk maps. This article explores the role of vegetation indices, remote sensing platforms, and GIS techniques in agricultural drought monitoring, highlighting applications, challenges, and future prospects.
Vegetation Indices for Drought Monitoring
Vegetation indices are mathematical transformations of satellite data that measure plant greenness, growth, and stress levels. They provide valuable information about how healthy or stressed vegetation is by analyzing the reflection of light in different spectral bands. Since crops and plants respond quickly to changes in soil moisture, these indices are highly effective in detecting agricultural drought. A decline in vegetation indices usually indicates that plants are under water stress, making VIs a reliable and cost-effective tool for monitoring drought impacts on agriculture.
Normalized Difference Vegetation Index (NDVI)
The Normalized Difference Vegetation Index is one of the most widely used vegetation indices in remote sensing for assessing vegetation health and drought conditions. It is calculated using the formula NDVI = (NIR – Red) / (NIR + Red), where NIR represents near-infrared light and Red represents visible red light reflected by plants. Healthy vegetation absorbs most of the red light for photosynthesis while reflecting a large portion of NIR light, resulting in high NDVI values.
In contrast, stressed or sparse vegetation reflects more red light and less NIR light, giving lower NDVI values. NDVI values generally range from -1 to +1, where values closer to +1 indicate dense, healthy vegetation, values near 0 represent bare soil, and negative values usually correspond to water or non-vegetated surfaces. Because of its ability to capture vegetation greenness and vigor, NDVI is extensively used in agricultural drought monitoring, crop yield forecasting, and land cover classification.
Vegetation Condition Index (VCI)
The Vegetation Condition Index is an advanced vegetation index developed to assess drought severity by comparing the current vegetation state with its historical range. It is based on the NDVI but reduces the effects of geographical and seasonal variations. The formula is:
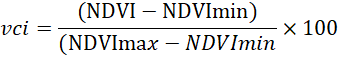
NDVImin and NDVImax represent the historical minimum and maximum NDVI values for a specific location and time. VCI values range from 0 to 100, where values close to 0 indicate extreme drought and vegetation stress, while values near 100 indicate favorable or healthy conditions. This makes VCI a more reliable indicator than NDVI alone, especially for detecting short-term drought impacts on crops. By normalizing NDVI against historical data, VCI helps in distinguishing between naturally low vegetation cover (such as deserts) and actual drought-induced vegetation stress, making it highly effective for regional drought monitoring, agricultural planning, and early warning systems.
Vegetation Health Index (VHI)
The Vegetation Health Index (VHI) is a composite drought monitoring index that combines both vegetation greenness and temperature conditions to provide a more reliable picture of vegetation stress. It is calculated using two components: the Vegetation Condition Index (VCI), which reflects vegetation greenness based on NDVI, and the Temperature Condition Index (TCI), which measures heat stress using thermal satellite data. The formula is usually expressed as:
VHI = a × VCI + (1 – a) × TCI
where a is a weighting factor, often set to 0.5 for equal contribution. VHI values range from 0 to 100, with lower values indicating severe drought or vegetation stress, and higher values representing healthy conditions. Unlike NDVI or VCI alone, VHI captures the combined impact of moisture shortage and high temperature, making it particularly effective for monitoring agricultural drought and predicting crop yield losses. It is widely used in global drought early warning systems, food security assessments, and climate change impact studies.
Other Useful Indices
- Enhanced Vegetation Index (EVI): Improves sensitivity in high biomass areas.
- Normalized Difference Water Index (NDWI): Measures vegetation water content.
- Drought Severity Index (DSI): Integrates multi-spectral information for drought detection.
Role of Remote Sensing in Agricultural Drought Monitoring
Remote sensing satellites such as MODIS, Landsat, Sentinel-2, and NOAA AVHRR are very useful for drought monitoring because they provide continuous and large-scale data over time. These satellites can cover vast agricultural regions at once (synoptic coverage) and repeatedly collect images, which helps in monitoring seasonal changes and long-term drought patterns (temporal monitoring).
Compared to traditional field surveys, satellite observations are much more cost-effective, saving both time and resources. Since these satellites capture data in multiple spectral bands (multispectral capability), they allow the calculation of vegetation indices like NDVI, VCI, and VHI that reveal vegetation health. Most importantly, remote sensing can detect the early signs of drought stress in crops even before visible damage appears, giving farmers and policymakers a chance to take timely actions for mitigation and food security.
GIS Applications in Agricultural Drought Assessment
GIS enhances drought monitoring by integrating spatial datasets such as rainfall, soil moisture, temperature, land use, and topography with vegetation indices. Its applications include:
Spatial Modeling: Combining remote sensing indices with climate and soil data to assess drought risk.
Mapping: Generating drought severity maps at village, district, or national scales.
Data Integration: Overlaying crop type maps, irrigation networks, and meteorological data.
Decision Support: Providing information for drought management policies and agricultural planning.
Scenario Analysis: Simulating climate change impacts on drought patterns.
Early Warning Systems: Vegetation indices are widely used in drought early warning systems (DEWS) to provide timely alerts. For example, the Famine Early Warning Systems Network (FEWS NET) uses NDVI and other indices to monitor food security in Africa and Asia.
Yield Prediction: GIS and remote sensing data improve crop yield forecasting models by detecting drought-induced stress. NDVI-based yield models have been used for wheat and rice forecasting.
Regional Drought Risk Mapping: Using NDVI and VCI in GIS, regions such as Sub-Saharan Africa and South Asia have been mapped for drought vulnerability, guiding relief efforts and resource allocation.
Localized Applications: At smaller scales, farmers and policymakers use UAV (drone) data integrated with GIS for field-level drought assessment and irrigation management.
Limitations and Challenges Agricultural Drought Monitoring Using Remote Sensing & GIS
- Cloud cover: Hinders optical remote sensing data availability.
- Index saturation: NDVI saturates in dense vegetation conditions.
- Mixed signals: Bare soil and sparse crops can distort vegetation index readings.
- Ground validation: Remote sensing data must be calibrated with field observations.
- Data accessibility: High-resolution data can be costly and require technical expertise.
Future Directions in Agricultural Drought Monitoring Using Remote Sensing
The future of agricultural drought monitoring lies in the integration of:
- High-resolution satellite data (Sentinel-2, Planet Scope).
- Microwave sensors for soil moisture mapping (SMAP, AMSR-E).
- Machine learning and AI models for predictive drought mapping.
- Big Data and cloud platforms (Google Earth Engine, AWS).
- Citizen science and IoT sensors combined with GIS for near real-time monitoring.
Vegetation indices derived from remote sensing, when integrated with GIS, provide a powerful toolset for agricultural drought monitoring. NDVI, VCI, and VHI are effective indicators for detecting vegetation stress and quantifying drought severity.
Remote sensing ensures consistent, large-scale observations, while GIS adds analytical depth and visualization capabilities. Although challenges exist, technological advancements are steadily improving accuracy and applicability. Strengthening drought monitoring through remote sensing and GIS is essential for sustainable agriculture, effective policy-making, and climate resilience.