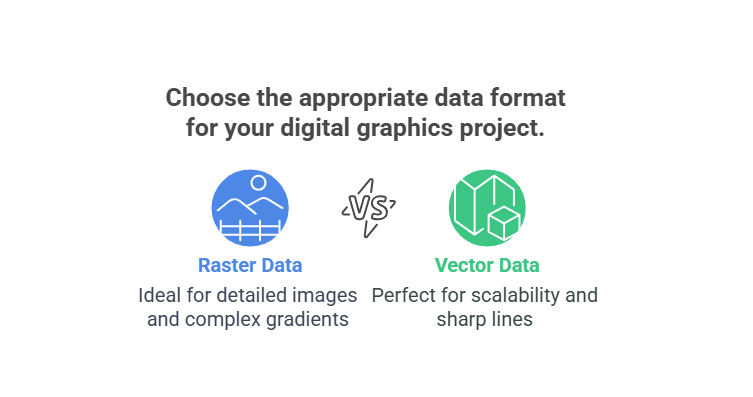
In the world of Geographic Information Systems (GIS), spatial data is the foundation of every analysis, map, and decision. Whether you’re tracking changes in land use, analyzing population growth, or planning infrastructure, you’re working with spatial data. But not all spatial data is the same — it mainly comes in two fundamental formats: Raster and Vector.
These two data types represent the world in completely different ways. While Raster data divides space into a grid of pixels, Vector data uses points, lines, and polygons to define locations and shapes. Each has its strengths, weaknesses, and ideal use cases.
What is Vector Data?
Vector data is one of the two primary data models used in Geographic Information Systems (GIS) to represent real-world features. Unlike raster data, which represents space as a grid of pixels, vector data uses geometric shapes, points, lines, and polygons, to accurately model the physical locations, shapes, and boundaries of discrete features on the earth’s surface.
Each vector feature is defined by a set of coordinates (x, y or x, y, z) and is associated with attribute data stored in tables. These attributes describe the characteristics of the feature, such as its name, type, area, population, or any other relevant information.
Components of Vector Data
Vector data is categorized into three basic geometry types:
Point:
Point vector data represents specific locations on the Earth’s surface with no dimensions—only position. Each point is defined by a single set of coordinates (x, y), and it is used to map features that are too small to be represented by lines or areas at a given scale. Examples include the location of trees, wells, utility poles, weather stations.
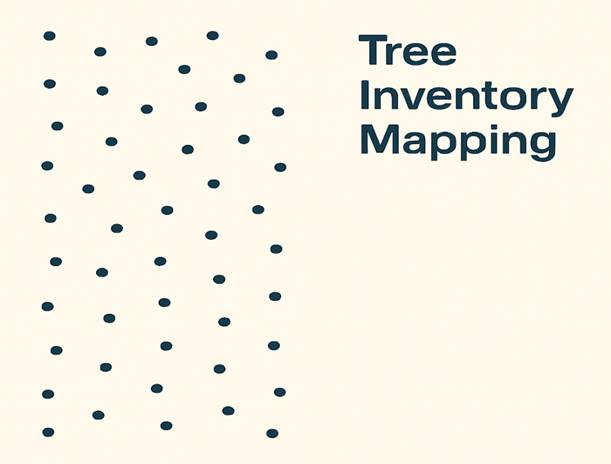
Represents vector point data of individual tree locations distributed across a mapped area.
Line (or Polyline):
Line or polyline vector data represents linear features that have length but no area. A line is composed of a sequence of connected points (vertices), each with x and y coordinates. This type of vector data is commonly used to map roads, rivers, pipelines, power lines, and transportation routes.
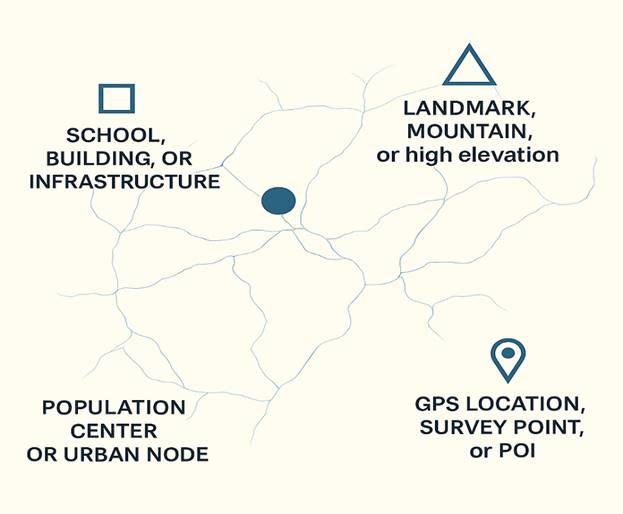
Road network map with labeled symbols representing: infrastructure, urban center
Polygon:
Polygon vector data represents area features with boundaries. A polygon is formed by a closed loop of lines (connected points), enclosing a space that has both shape and area. This type of data is used to represent features like countries, states, lakes, buildings, agricultural fields, and land parcels. Each polygon can store rich attribute data, such as land use type, ownership information, or zoning code.
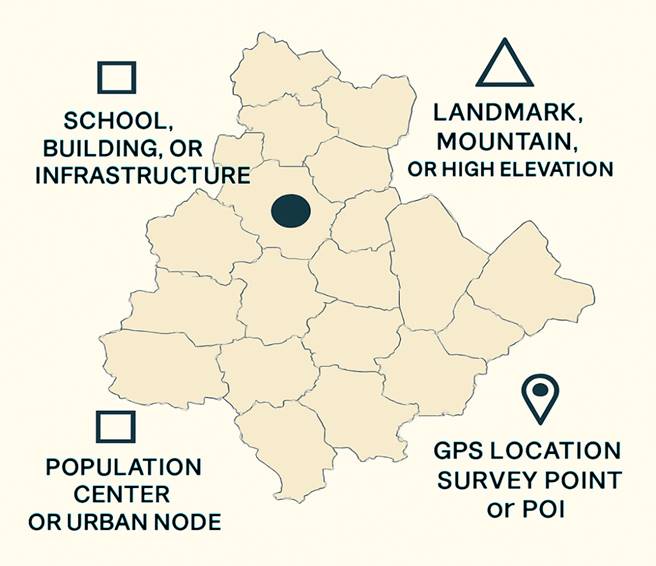
Represents district-level administrative boundaries
Common Vector File Formats:
Vector data is stored in various file formats, including:
- .shp – Shapefile (most widely used format in GIS)
- .geojson – JSON-based open standard format
- .kml/.kmz – Used in Google Earth
- .gdb – File geodatabase (used by Esri’s ArcGIS)
- .dxf – AutoCAD format, often used for engineering/GIS integration
What is Raster Data?
Raster data is a type of spatial data used in Geographic Information Systems (GIS) that represents geographic information through a grid of cells or pixels. Each cell in the grid contains a numeric value that represents information such as color, temperature, elevation, vegetation health, land cover type, or other measurable variables at that specific location.
Raster data is best suited for representing continuous phenomena, where changes happen gradually over space—such as terrain, weather, or imagery from satellites.
Imagine a raster as a digital photograph: each tiny square (pixel) has a color value. In GIS, however, each pixel can represent real-world variables, making raster a powerful tool for spatial analysis.
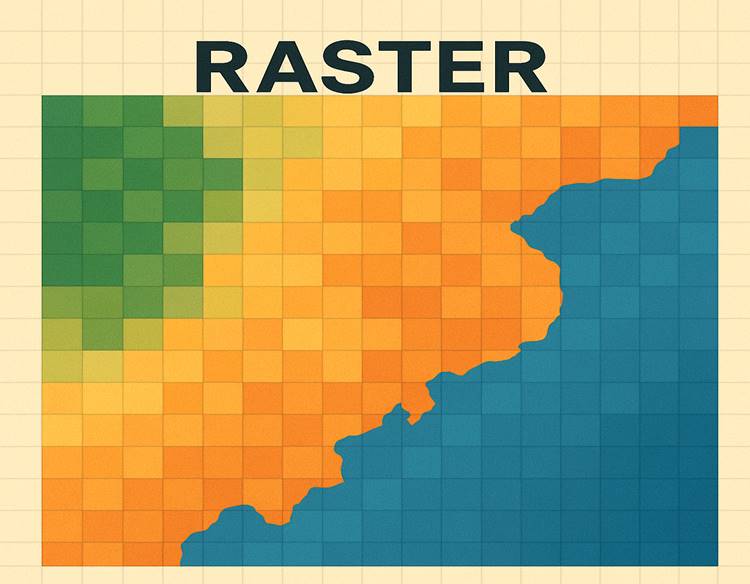
Shows land cover variation representing vegetation, terrain, and water areas.
Structure of Raster Data:
Raster data is structured as a matrix made up of:
- Rows and columns of pixels (or cells)
- Each pixel represents a fixed area on the Earth’s surface (e.g., 30 meters x 30 meters)
- Each pixel holds a single value, which can be:
- A measured value (e.g., temperature, elevation)
- A category/class (e.g., forest = 1, water = 2, urban = 3)
- A color or reflectance value (in remote sensing)
Types of Raster Data:
Discrete Raster Data:
Also known as categorical raster data, this type represents features with distinct boundaries and identifiable categories. Each cell contains a value that corresponds to a specific class or label, such as land cover types (forest, water, urban), soil classes, or administrative zones.
Continuous Raster Data:
Continuous raster data represents phenomena that change gradually across space and are measured on a scale. Each pixel has a floating-point value indicating the magnitude of a variable, such as elevation, temperature, precipitation, or NDVI (Normalized Difference Vegetation Index).
Thematic Raster Data:
Thematic raster data is used to represent specific themes or topics. It can be either discrete or continuous depending on the nature of the theme. Examples include land cover maps (discrete), vegetation health (continuous), and hazard risk maps (continuous or ranked).
Common Raster File Formats:
- .tif / .tiff – GeoTIFF (widely used with georeferencing)
- .img – ERDAS Imagine format
- .asc – ASCII grid
- .jpg / .png – For simple visual rasters, not always georeferenced
- .hdf, .nc – Used for scientific datasets (e.g., MODIS)
Which Should You Use: Raster vs Vector Data?
Choosing between raster and vector data depends largely on the type of geographic information you’re working with and the purpose of your analysis. Vector data is best suited for representing discrete features with clearly defined boundaries and positions, such as roads, buildings, rivers, land parcels, or administrative boundaries.
If your project involves mapping specific locations, working with attribute-rich features (like identifying the owner or area of a land parcel), or producing sharp, high-quality maps, then vector data is the ideal choice. It allows for high spatial precision and is easier to link with detailed, tabular data for queries and analysis. For example, urban planners, cadastral mapping, and transportation network modeling typically rely on vector data for its accuracy and attribute flexibility.
On the other hand, raster data is the better choice when dealing with continuous phenomena that vary gradually across space. Raster datasets represent data as a grid of pixels, where each pixel holds a value that describes a certain attribute of that location—such as elevation, temperature, land cover, or vegetation health.
This makes raster ideal for satellite imagery, digital elevation models (DEMs), climate data, and remote sensing applications. Raster is also the preferred format when performing spatial analyses such as terrain modeling, NDVI computation, and suitability analysis. It handles complex surface data well and is optimized for calculations involving large areas or multi-band imagery.
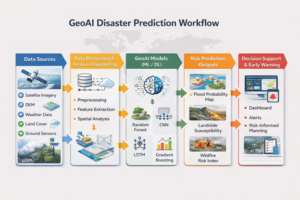
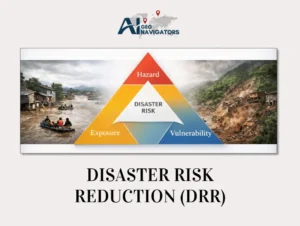
In practice, many GIS projects benefit from using both raster and vector data togethera disaster risk assessment may combine a raster-based flood risk map with vector data showing population centers or critical infrastructure. This synergy allows for richer, more meaningful spatial insights.
In summary, if your data represents individual objects with attributes, and you need precision and structure, go with vector. If your data is continuous, image-based, or you’re performing complex spatial analysis, raster is the better option.
Raster vs Vector Data: Comparison Table
| Aspect | Raster Data | Vector Data |
|---|---|---|
| Data Structure | Grid of pixels (cells) | Points, lines, and polygons defined by coordinates |
| Best For | Continuous data (e.g., elevation, temperature, NDVI) | Discrete features (e.g., roads, buildings, land parcels) |
| Data Representation | Each cell represents a value over an area | Each feature is a geometric shape with attributes |
| Resolution Dependency | Yes – determined by pixel size (e.g., 10m, 30m) | No – precise coordinates define features |
| File Size | Typically large, especially at high resolution | Usually smaller, unless many complex features are included |
| Visual Quality | Can appear pixelated, especially for boundaries | Clean and crisp lines and edges |
| Attribute Storage | Limited – one value per pixel (or per band) | Rich attribute tables with multiple fields per feature |
| Accuracy | Limited by resolution | Highly accurate – defined by exact coordinates |
| Cartographic Quality | Less suitable for high-quality maps | Excellent for map production |
| Examples of Use | Satellite imagery, DEMs, land cover, NDVI | Administrative boundaries, roads, buildings, utilities |
| Analysis Capability | Excellent for surface analysis, classification, NDVI | Best for spatial queries, buffering, network analysis |
| Speed of Processing | Faster for large-scale analysis (e.g., terrain modeling) | Slower for complex overlays with many features |
| Data Sources | Remote sensing, aerial photography, environmental models | GPS, surveys, digitized maps |
| Software Compatibility | Remote sensing tools, raster GIS (e.g., QGIS, ArcGIS) | GIS platforms (QGIS, ArcGIS, AutoCAD Map) |
Advantages of Raster Data:
Represents continuous data:
Raster data is highly effective for representing continuous spatial phenomena, such as elevation, temperature, and vegetation health. Because each cell contains a specific value, it allows for the smooth representation of gradual changes across a landscape, making it ideal for environmental and surface modeling.
Best for satellite and aerial imagery:
It is the standard format for satellite and aerial imagery, storing spectral reflectance values at the pixel level. This makes raster data essential for remote sensing applications like land cover classification, vegetation monitoring, and detecting environmental changes over time.
Spatial Analysis and Modeling:
Raster data excels in spatial analysis and modeling, especially when performing operations such as slope calculation, hydrological modeling, or NDVI analysis. The consistent cell-based structure allows for fast and efficient processing of complex mathematical operations.
Handle multiband and temporal datasets:
One of the strengths of raster data is its ability to handle multiband and temporal datasets. You can analyze multiple wavelengths simultaneously—such as red, green, blue, and infrared—to derive indices like NDVI. Additionally, raster datasets are suitable for time-series analysis to observe trends and changes.
Simple and uniform structure:
With its simple and uniform structure, raster data is easy to manage and process. Every cell has the same size and shape, simplifying computations and reducing the complexity found in vector geometry like vertices or topology.
Machine learning and artificial intelligence applications:
Raster formats are also highly compatible with machine learning and artificial intelligence applications. Their consistent pixel format is ideal for training and feeding data into AI models for classification, object detection, and predictive analysis.
Easily combined and overlaid:
Moreover, raster layers can be easily combined and overlaid to conduct multi-criteria evaluations. For instance, combining raster maps of soil type, slope, and rainfall can help determine flood-prone zones or agricultural suitability.
Zonal and statistical analysis:
Lastly, raster data supports zonal and statistical analysis, allowing you to summarize pixel values with in defined vector zones (like districts or parcels). This feature is widely used in agriculture, forestry, climate studies, and land management for deriving region-specific statistics.
Advantages of Vector Data:
High spatial accuracy:
Vector data provides high spatial accuracy, making it ideal for representing discrete geographic features like roads, buildings, rivers, and administrative boundaries. Each feature is precisely defined by coordinates, which ensures accurate measurements and clear delineation of shapes and edges.
Store detailed attribute information:
One of the key strengths of vector data is its ability to store detailed attribute information. Each point, line, or polygon can be linked to a data table containing multiple fields, enabling complex queries and in-depth analysis based on real-world characteristics.
Clean and crisp visual representation:
With clean and crisp visual representation, vector data is ideal for cartographic outputs. Unlike raster data, which can appear pixelated, vector graphics scale without losing quality, making them perfect for detailed maps and professional reports.
Efficient in storage:
Vector data is generally more efficient in storage when dealing with fewer, more complex features. It avoids the large file sizes associated with high-resolution raster datasets and can represent boundaries or shapes with minimal data redundancy.
Flexibility in editing and updating:
The flexibility in editing and updating is another advantage of vector data. Features can be easily moved, reshaped, or updated without affecting the entire dataset, which is particularly useful for datasets that require regular maintenance.
Advanced spatial queries:
Vector data supports advanced spatial queries such as buffer generation, intersection, union, and area calculation. These capabilities are critical for land use planning, zoning analysis, and emergency response planning.
Widely supported by GIS software:
Vector data is widely supported by GIS software such as QGIS, ArcGIS, AutoCAD Map, and others, making it a universally accepted format in geospatial workflows. Its compatibility and precision make it a fundamental component of most GIS projects.
Raster to Vector Conversion Services by AI Geo Navigators
AI Geo Navigators offers a professional Raster to Vector conversion service designed to transform pixel-based raster images, such as scanned maps, satellite images, and aerial photos, into precise, editable vector formats.
Utilizing advanced AI and machine learning techniques, the service accurately traces and converts geographic features, points, lines, and polygons, ensuring high spatial accuracy and rich attribute data.
This service is ideal for GIS professionals, urban planners, environmental analysts, and anyone needing to integrate raster data into vector-based GIS workflows for enhanced analysis, mapping, and decision-making.