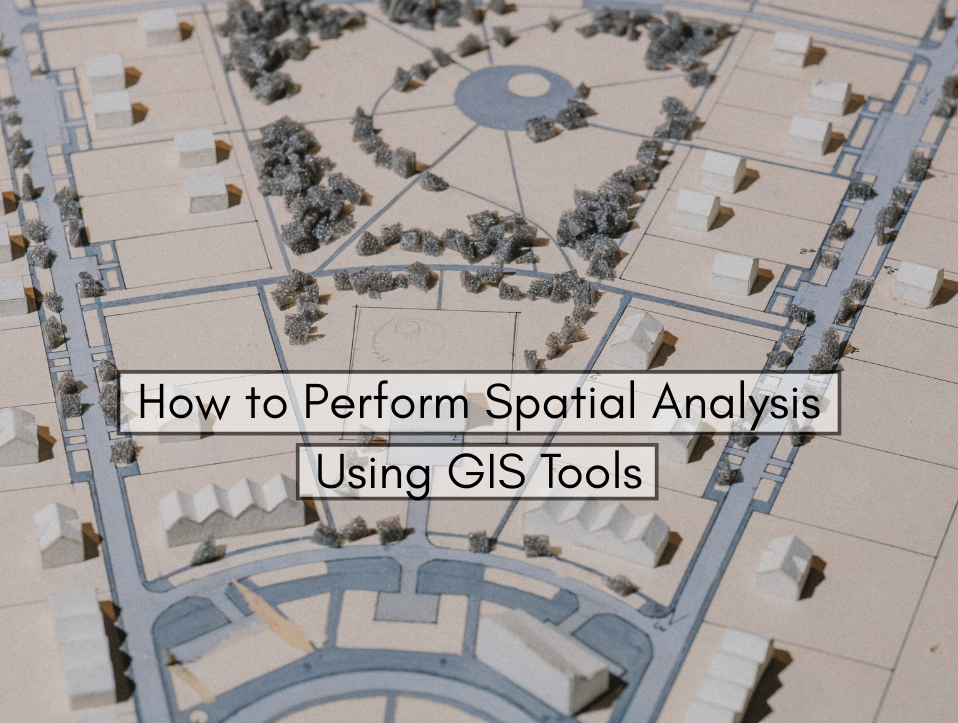
This guide explains how to perform spatial analysis using GIS tools step by step, including concepts, methods, and software. Whether you’re a beginner or a data analyst looking to sharpen your skills, this blog offers a comprehensive look into spatial analysis using GIS.
Introduction to Spatial Analysis in GIS
In today’s data-driven world, understanding where something happens is just as important as what is happening. That’s where spatial analysis comes in the heart of Geographic Information Systems (GIS). From urban planning and environmental monitoring to business site selection and public health mapping, spatial analysis enables decision-makers to gain powerful insights from location-based data.
What is Spatial Analysis?
Spatial analysis is the process of examining the patterns, relationships, and trends in geographic (spatial) data. It involves the application of statistical and computational techniques to spatial information, helping you answer questions like:
- Where are hotspots of disease outbreaks?
- Which areas are most vulnerable to flooding?
- How does population density vary across a city?
Spatial analysis isn’t just about creating maps — it’s about understanding the data behind the map.
Core Components of Spatial Analysis
Before diving into tools and methods, it’s essential to understand the core components of spatial analysis:
1. Spatial Data
There are two main types of spatial data:
- Vector data (points, lines, polygons)
- Raster data (grids or cells, like satellite images)
2. Attributes
Each spatial element has associated data (e.g., population, rainfall, elevation), which is analyzed along with its location.
3. Spatial Relationships
Spatial analysis often investigates proximity, adjacency, connectivity, and patterns over space.
Types of Spatial Analysis
1. Buffer Analysis
This method creates zones around features (e.g., schools, rivers) to determine the impact area. For example, a buffer of 500 meters around factories can be used to analyze pollution zones.
2. Overlay Analysis
Combines multiple data layers to find intersections or relationships. Example: Overlapping flood zones with residential areas to identify at-risk homes.
3. Proximity Analysis
Determines how close or far objects are from each other. Retailers often use this to find the nearest store locations or customer clusters.
4. Hotspot Analysis
Identifies statistically significant spatial clusters (e.g., areas with high crime or disease incidence).
5. Network Analysis
Used for transportation and logistics, finding the shortest route, service areas, or delivery optimization.
6. Spatial Interpolation
Estimates values at unsampled locations using known data points (e.g., predicting rainfall across a region).
Step-by-Step: How to Perform Spatial Analysis Using GIS Tools
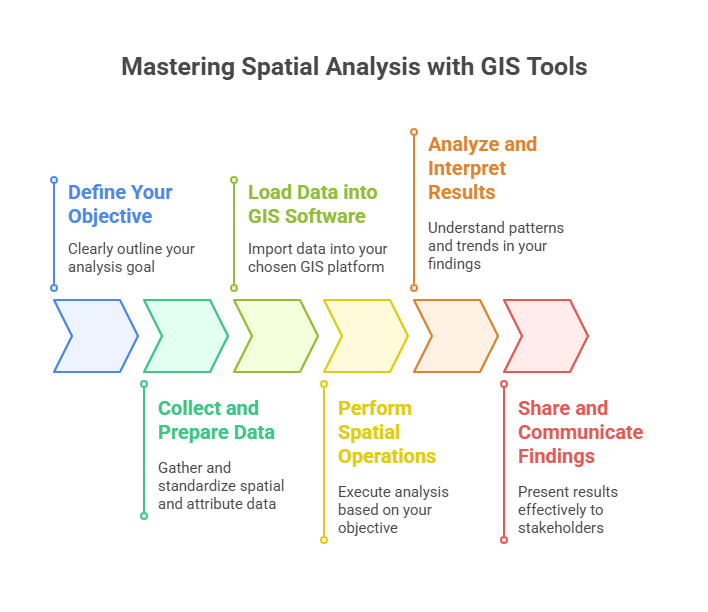
Performing spatial analysis using GIS tools requires a thoughtful approach, combining technical operations with critical thinking. Each step plays a crucial role in shaping accurate and insightful results. Below is a deeper look into each stage of the spatial analysis workflow.
Step 1: Define Your Objective
Every effective spatial analysis begins with a well-defined goal. Before opening any GIS software or importing data, you should clearly understand what you’re trying to achieve. Are you trying to find the best location for a new retail store? Or perhaps analyze flood-prone zones in a district? Your objective will shape your data requirements, analysis methods, and output formats.
This step involves identifying the key questions you want the analysis to answer. It’s important to phrase the problem in a spatial context. For example, instead of asking “Where should we open a new hospital?”, a GIS-oriented version would be “Which areas are underserved by existing hospitals within a 5km radius of high-population zones?” This kind of spatial thinking ensures the rest of your workflow remains targeted and actionable.
Step 2: Collect and Prepare Data
Once your objective is clear, the next step is data collection. This involves gathering both spatial (geographic) and non-spatial (attribute) data from credible sources. Spatial data includes elements like roads, rivers, buildings, elevation models, and administrative boundaries — often in vector or raster formats. Attribute data could be population counts, land use classifications, environmental quality scores, etc., usually stored in spreadsheets or databases.
After collecting your data, you’ll need to clean and standardize it. This includes checking for missing values, removing duplicates, and ensuring consistency in naming conventions. Equally important is confirming that all spatial layers use the same coordinate reference system (CRS).
Mismatched CRS can lead to misalignment of layers and false analysis results. Data preparation also includes cropping, filtering, and clipping your data to focus only on your area of interest, which improves performance and readability.
Step 3: Load Data into GIS Software
Now that your data is ready, the next step is to load it into a GIS software platform. Depending on your needs and budget, you can use QGIS (a powerful open-source tool), ArcGIS Pro (industry-standard commercial software), or even cloud-based platforms like Google Earth Engine or Mapbox for certain types of analysis.
Once the data is loaded, you can start organizing your layers within the project file. Vector layers (like roads and points of interest) and raster layers (like satellite imagery) should be styled with appropriate colors, symbols, and labels for clear visualization. Proper symbology helps in interpreting your data visually even before you run any analysis. Group related layers together, rename them for clarity, and ensure attribute tables are accessible and organized. This setup lays the foundation for a smooth analysis process.
Step 4: Perform Spatial Operations
This is the core stage of your workflow where the actual spatial analysis happens. The type of analysis you choose will depend entirely on your defined objective. For instance, if you’re analyzing service coverage, you might perform buffer analysis to draw zones around schools, hospitals, or fire stations. These zones help visualize which areas fall within a certain distance of critical infrastructure.
Other common operations include overlay analysis, where multiple data layers (like flood zones and land use maps) are combined to understand spatial relationships. Hotspot analysis helps identify clusters of events, like crimes or disease outbreaks, and is useful for strategic planning. Network analysis is used to determine optimal routes for logistics or emergency services. These tools are available in most GIS platforms, usually under spatial analysis or geoprocessing toolboxes. It’s crucial to double-check parameters like distance units, spatial extent, and data types before executing these operations to avoid errors.
Step 5: Analyze and Interpret Results
Once your spatial operations are complete, the next step is to make sense of the results. This involves more than just viewing colorful maps — it’s about understanding the patterns, trends, and anomalies revealed by your analysis. Ask yourself: Are there clusters? Are the patterns statistically significant? Do the results support or challenge your initial hypothesis?
For more rigorous insight, you can use statistical summaries, charts, or heatmaps to complement your spatial outputs. In some cases, you may need to validate your findings with field data or external sources. Interpretation also involves considering external factors that may influence your results, such as seasonal changes or socio-economic conditions. A good spatial analyst always cross-references findings with real-world context to ensure accurate conclusions.
Step 6: Share and Communicate Findings
The final step in any GIS workflow is to share your results in a way that others can understand and act upon. Effective communication is key — especially when your audience includes non-technical stakeholders such as government officials, investors, or the general public. Use clear map layouts with titles, legends, north arrows, and scale bars. Avoid clutter and focus on highlighting the most important insights.
Modern GIS platforms offer several ways to share your work. You can generate static map reports, publish interactive web maps, or create dashboards that combine spatial data with graphs and KPIs. Tools like ArcGIS StoryMaps or QGIS Atlas allow you to build narrative-driven visualizations, turning complex analyses into compelling stories. Exporting your findings in formats like PDF, GeoJSON, or Shapefiles also ensures interoperability across platforms.
GIS Tools for Spatial Analysis
Here are some of the top tools used globally:
| Tool | Type | Key Features |
| QGIS | Open-source | Buffers, overlays, plugins for advanced analysis |
| ArcGIS Pro | Commercial | Spatial statistics, 3D analysis, network tools |
| GeoDa | Free | Spatial econometrics, clustering, regression |
| Google Earth Engine | Cloud-based | Satellite imagery, temporal analysis |
| GRASS GIS | Open-source | Complex terrain modeling, raster math |
Best Practices for Effective Spatial Analysis
- ✅ Always clean and verify your data
- ✅ Use proper coordinate systems (e.g., WGS 84 vs local)
- ✅ Document your workflow for reproducibility
- ✅ Use legends, north arrows, and scale bars in maps
- ✅ Avoid overcrowding your map with too many layers
Common Challenges and How to Avoid Them
| Challenge | Solution |
| Poor data quality | Use reliable sources & clean data |
| Misaligned layers | Reproject datasets to a common CRS |
| Misinterpretation | Use statistical validation and peer review |
| Technical complexity | Use tutorials, forums, and open-source guides |
Use Cases of Spatial Analysis in Real Life
Public Health
Mapping COVID-19 hotspots helped cities allocate testing and hospital resources effectively.
Urban Planning
Planners assess land suitability for development based on terrain, zoning, and infrastructure.
Agriculture
Spatial analysis identifies soil health zones and irrigation requirements.
Disaster Response
Predicting flood-prone zones helps authorities evacuate vulnerable areas in time.
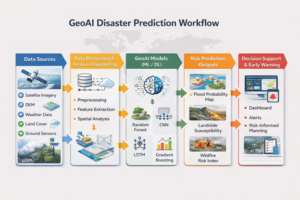
Future of Spatial Analysis: AI and Real-Time GIS
With the integration of AI, machine learning, and IoT, spatial analysis is becoming faster and more intelligent. Real-time traffic maps, drone-based surveys, and predictive risk mapping are just a few innovations powered by smart spatial analytics.
Conclusion
Spatial analysis is no longer limited to cartographers and geographers — it’s an essential skill across industries. With powerful GIS tools like QGIS and ArcGIS, even beginners can analyze complex location data to solve real-world problems.
Whether you’re evaluating land use, monitoring environmental change, or optimizing business operations, learning how to perform spatial analysis with GIS tools will put you ahead of the curve in a world increasingly reliant on where data.